

Working through my weekend reading yesterday I heard the subtle rumble of thunder in the distance. First storm of the year.
Spring is probably my favorite season if I had to pick one, the slowly greening grass and budding dogwoods give that welcome sense of renewal.
Storms show up this time of year too and I’ve always been drawn to them.
I will stay out as long as possible, radar in hand, retreating indoors only after the first oversized rain drop or lightning bolt gets my attention.
I did the exact same thing when I was a kid to Mom’s dismay. She has a picture of me, raincoat hood up playing in the sandbox with ominous black clouds looming overhead. “Just a few more minutes?…..”
We’ve encountered some storms and “disturbance” if you will these last few weeks in the markets as well. As I mentioned in Rip Currents, it was pretty well telegraphed but the velocity and magnitude raised my eyebrows.
In my mid-February The Slow Lane post I zoomed out to a monthly view on SPY and was taken aback by how toppy it appeared. I didn’t see it at the time but a discerning eye will also spot the RSI starting to roll over:
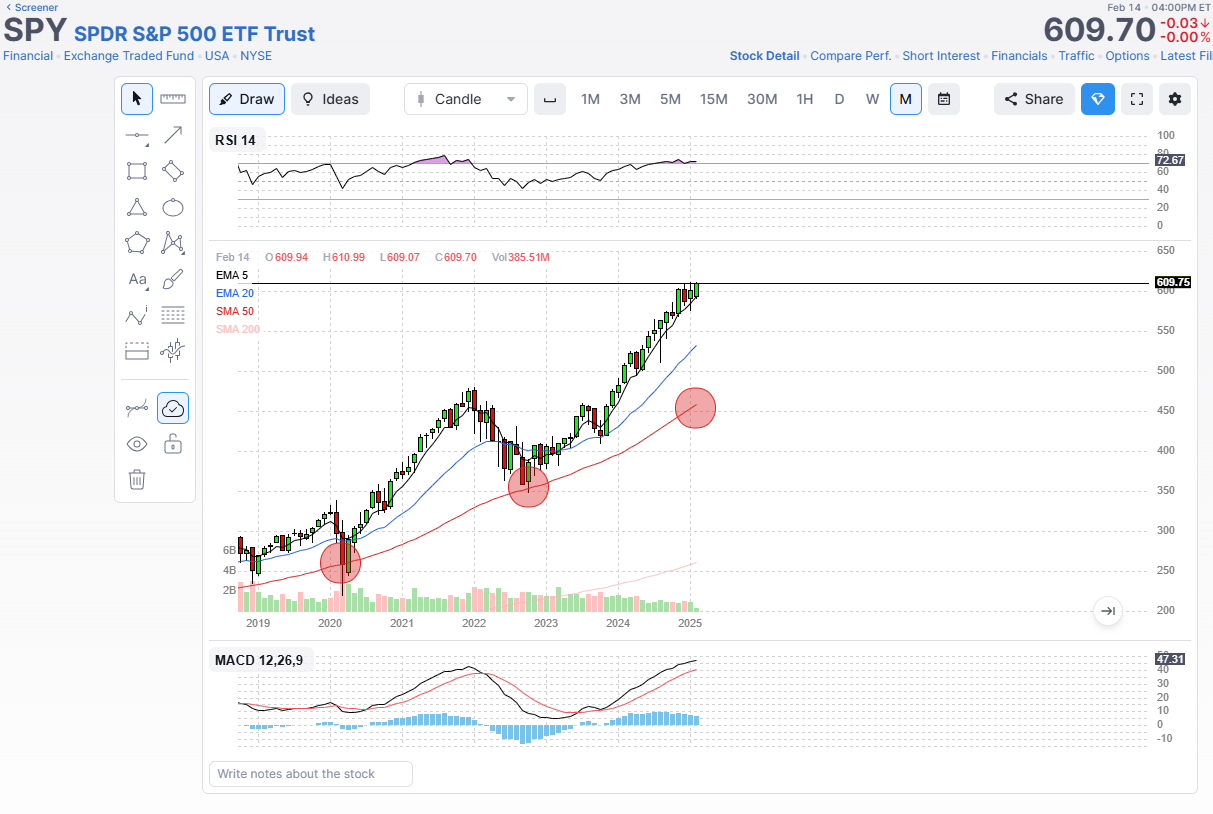
That snapshot above was taken on Valentine’s Day , I drew a line at 609.75 which I carried over the the daily chart for reference. Little did I know the carnage that would follow…
The chart below was from March 11, as I started to check off gap fills and prior bottom takeouts. The larger dashed line at the bottom at 551.90 marked the technical 10% “correction” mark, we checked that box too.
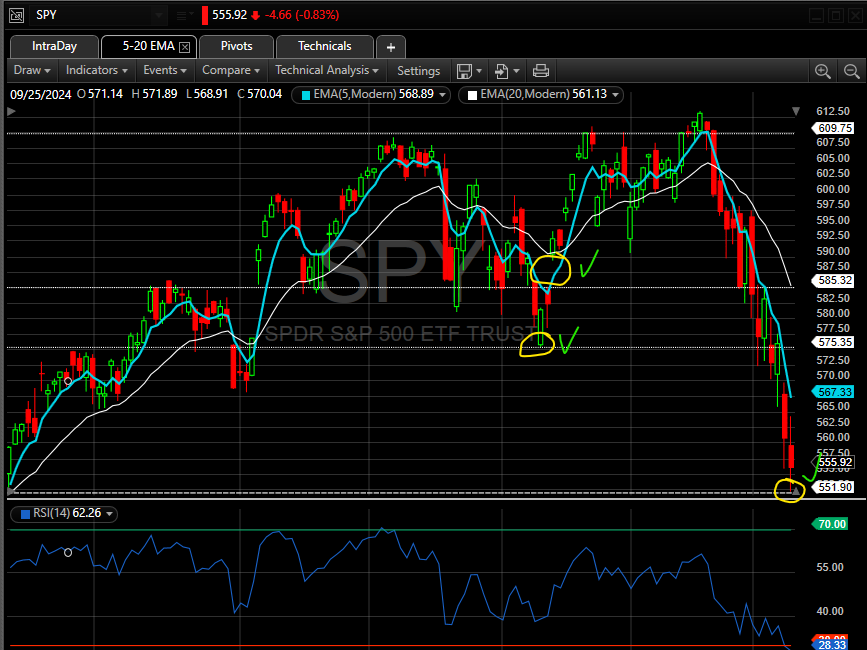
That is about 5 months of gains wiped out in 4 weeks.
To further put the magnitude of that move in perspective, I learned this weekend from my Lumida newsletter it was tied with two other 10% corrections for the 5th fastest in history. Those other two occurring in 1979 (Volcker vs. Inflation) and 1998 (The Asian Contagion).
Bottom line this was a massive repricing taking place almost immediately based on the level of uncertainty in front of us.
Another interesting statistic from the newsletter was that 10% corrections like we had this week are also rare, as in only 11 occurrences total since 1998. I would have assumed that number to be much higher.
I guess what is common, what is a given, is the simple fact they are eventually going to happen. When the 200 day moving average came into view I knew we would likely test it. We did. When the -10% correction line also came into view, ditto, we would likely test it too. We did.
So now what you ask? Nobody has a clue. Zilch. Nada. Any talking head on TV that pretends like they do is flipping a coin under the desk off-air and hoping they get it right.
I’m sure they are saying things like “dead cat bounce” and “relief rally” with a few “are there any dip buyers left?” sprinkled in for good measure. I wouldn’t know, they are all mercifully muted in my world.
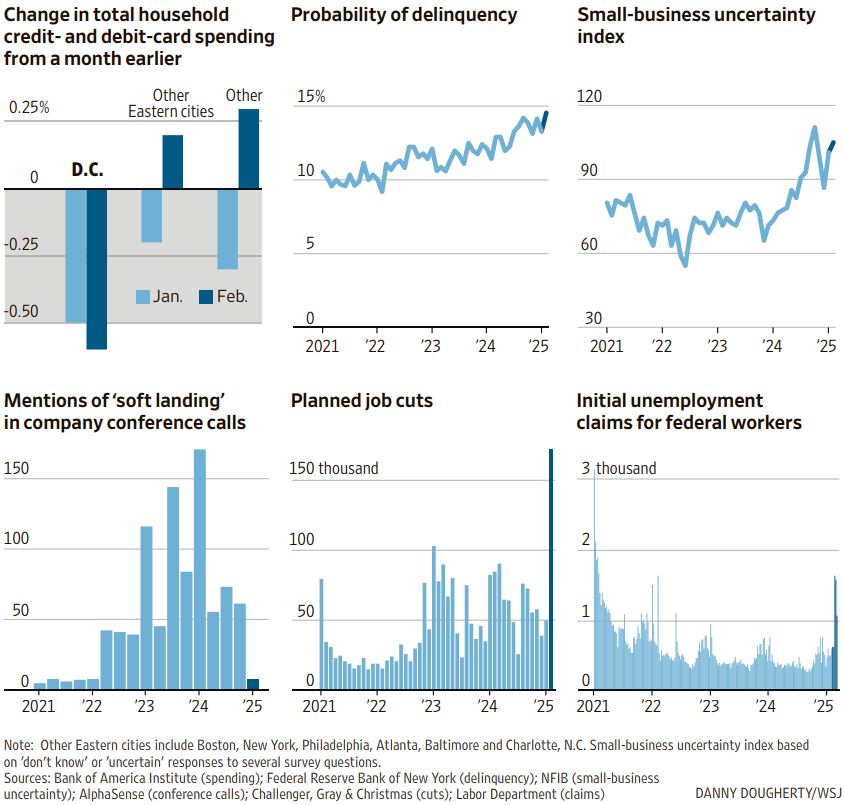
The weekend WSJ included this graphic below on what to watch for to help us “confirm a recession”. OK, so what are you trying to say?
I’ve been through all of this several times before so I am not really fazed by it but if I do start some hand wringing I try to zoom out. Your vantage point matters.
vantage point
: a position or standpoint from which something is viewed or considered
Here is the same SPY chart in a 1-yr timeframe:
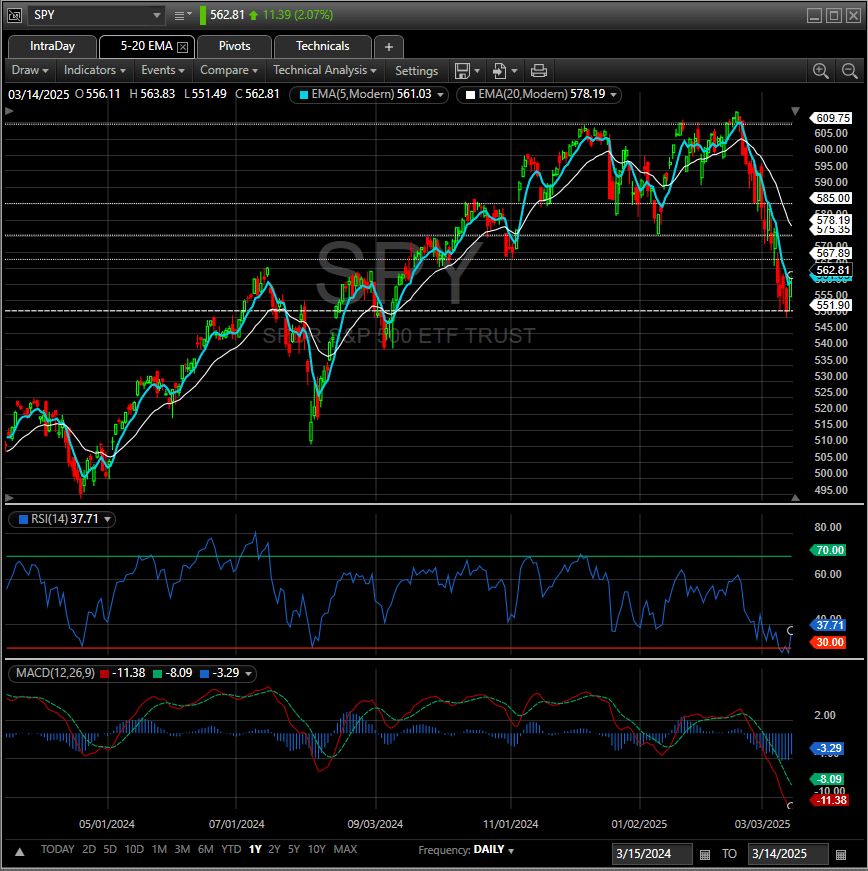
No denying the scary move to that -10% line, but also no denying the fact this could prove to be a great entry point longer-term!
Could it get worse? Absolutely. We could be talking about 20% bear market moves just as quickly as the 10% correction chatter entered the arena.
If moves like this keep you up at night, it may be time to evaluate your risk and exposure. Weathering volatility like this, swoons exactly like this, is the price paid for better returns in the long run.
Anyone more short-term focused or attempting to trade this better keep one hand on the mouse and one foot out the door. It’s going to get bumpy.
Here’s a great post from a great blogger about tuning out the noise.
What we need right now folks is increasing clarity over time.
Moves like the ones gracing the charts above do not get resolved in a matter of days or weeks, it will take months.
The market is in the process of attempting to price in uncertainty. The goalposts are shifting every day, sometimes multiple times in the same day.
The inflation numbers reported this week look good and allow the Fed some breathing room but they have yet to reflect any of the future trade policies being discussed in D.C.
The sentiment numbers out this week however were a dumpster fire and trending lower:
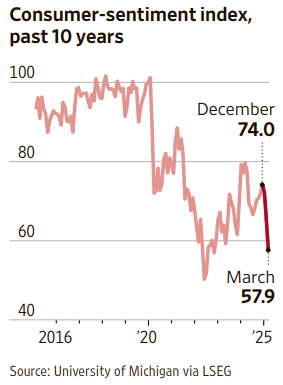
Will those same consumers be willing (and able?) to pony up for higher prices (again) driven by relentless repatriation?
Will the market be able to get in front of this and correctly price it in over time without another 10% drawdown?
Time and only time will tell.