

Well I had been mulling this weekend’s post since Saturday morning, I thought it was going to be a slow methodical gathering of thoughts. Then Saturday night happened.
I won’t be talking about that anymore I put it to bed in my prior post The Reckoning. At this point like many others, I am just nervously curious where things go from here.
As I write this Sunday evening, the futures are green, yet another act of defiance one could say in the face of increasing adversity. Increasing uncertainty. A market that was already starting to price in Trump 2.0 will no doubt do more of the same after this weekend.
Now to level-set some thoughts heading into the week and ultimately the second half of the year…
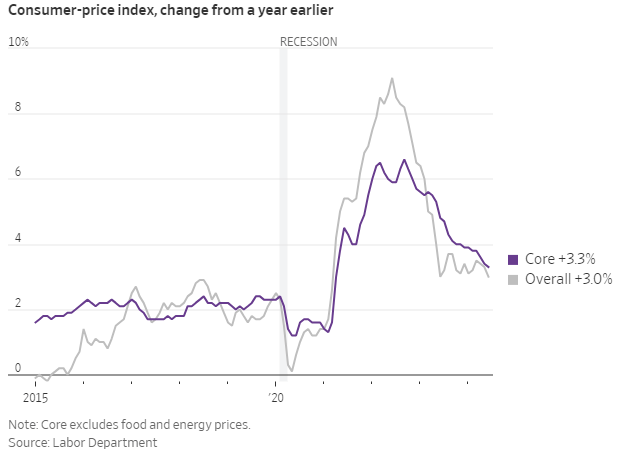
Before we get to the charts, a quick reminder about the CPI print that came in lower than expected. We now sit firmly at 3%, one must begin to wonder at what point the Fed starts to lean toward cuts sooner than later. Do we really need to get down to 2%? I don’t think so.
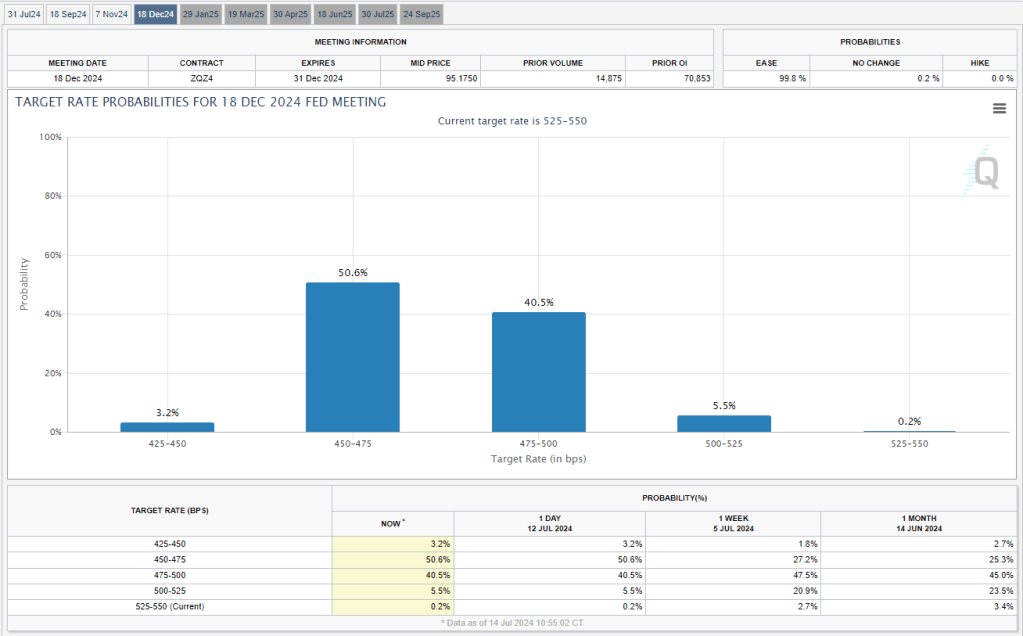
Barring any reinflationary data between now and September, our first 25bps cut looks to be 90% dialed in for Sept. You can scroll through the CME Fed Watch Tool probabilities for Jul/Sep/Nov/Dec below:


The yield curve is still inverted and has been since July ’22. The recession that never came? It is showing signs of wanting to crawl back to the zero line:
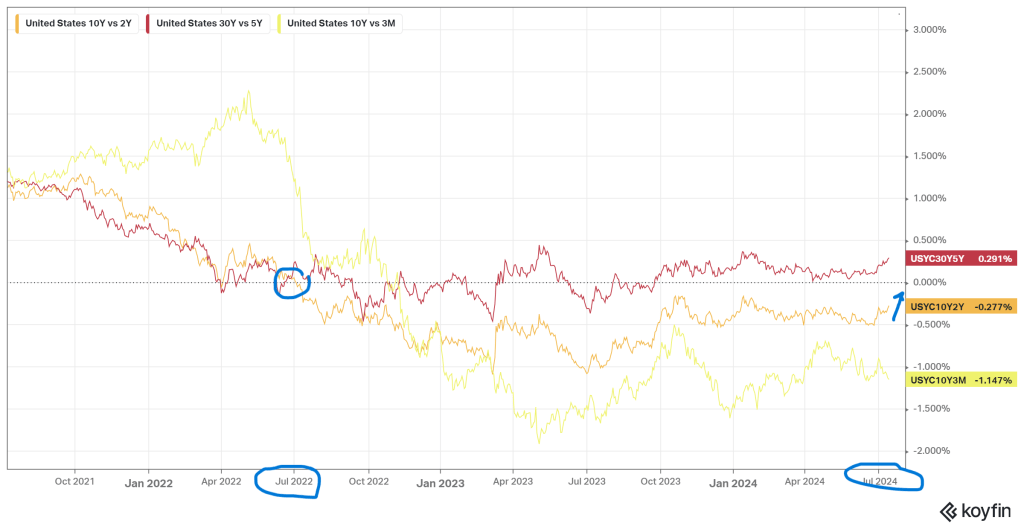
One would expect over the coming months for the front end to continue lower while (hopefully) the longer end creeps higher bringing the overall curve back into “normalization”:

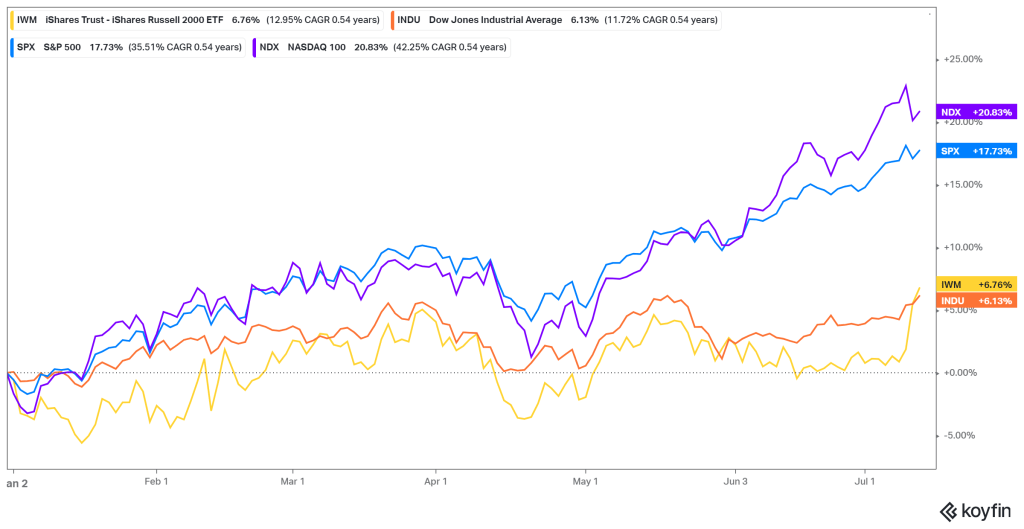
Quick look at the indices and you can see large cap tech heavy QQQ and SPY leading the way, trailed by the Dow and Russell 2000. Note the recent uptick in smalls, more on that later.
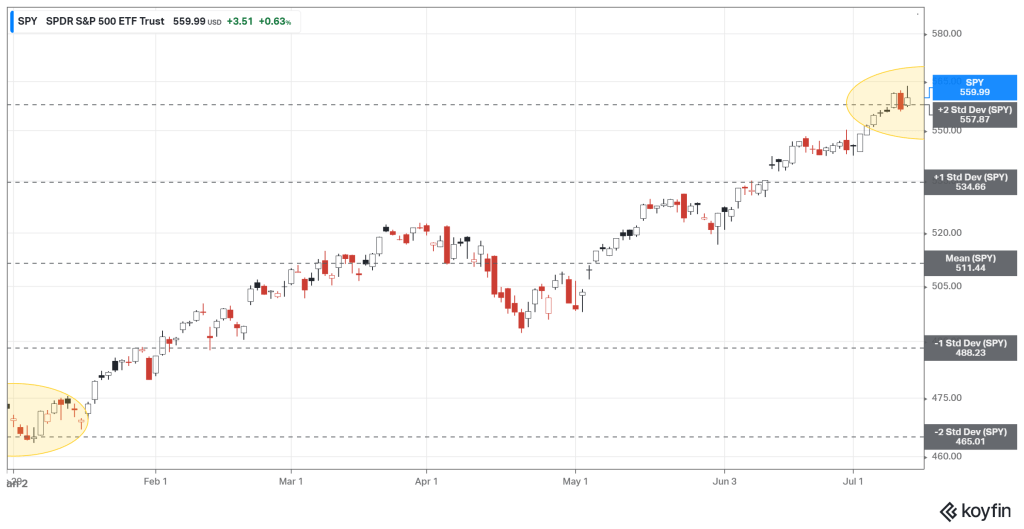
We have now covered a full 2 standard deviation range top to bottom in SPY for 2024 YTD:
Good piece here from Sofi’s Liz Thomas on the current market valuation. Worth the read. The chart below stood out most to me, because it frames it up in terms of historical CPI ranges, which if you recall we just entered the bottom of the 3-4% range:
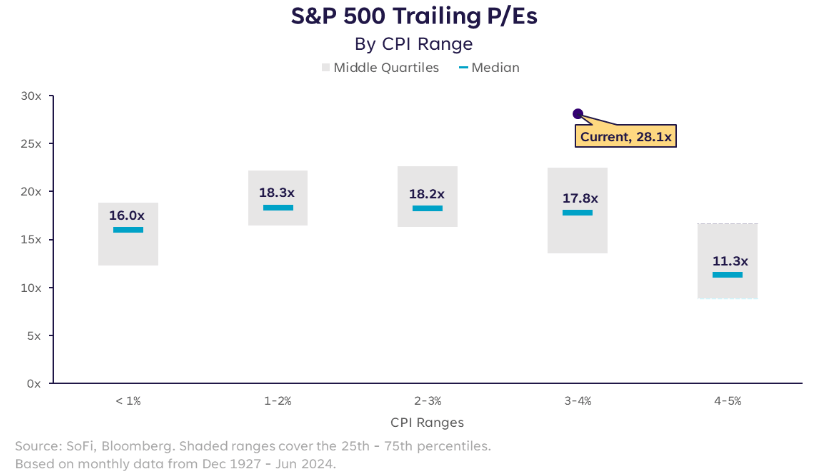
With the current trailing P/E at roughly 28x, you can see we are off the chart even when compared to ranges at much lower CPI readings. Takeaway? We remain very extended even with inflation data poised to recede:
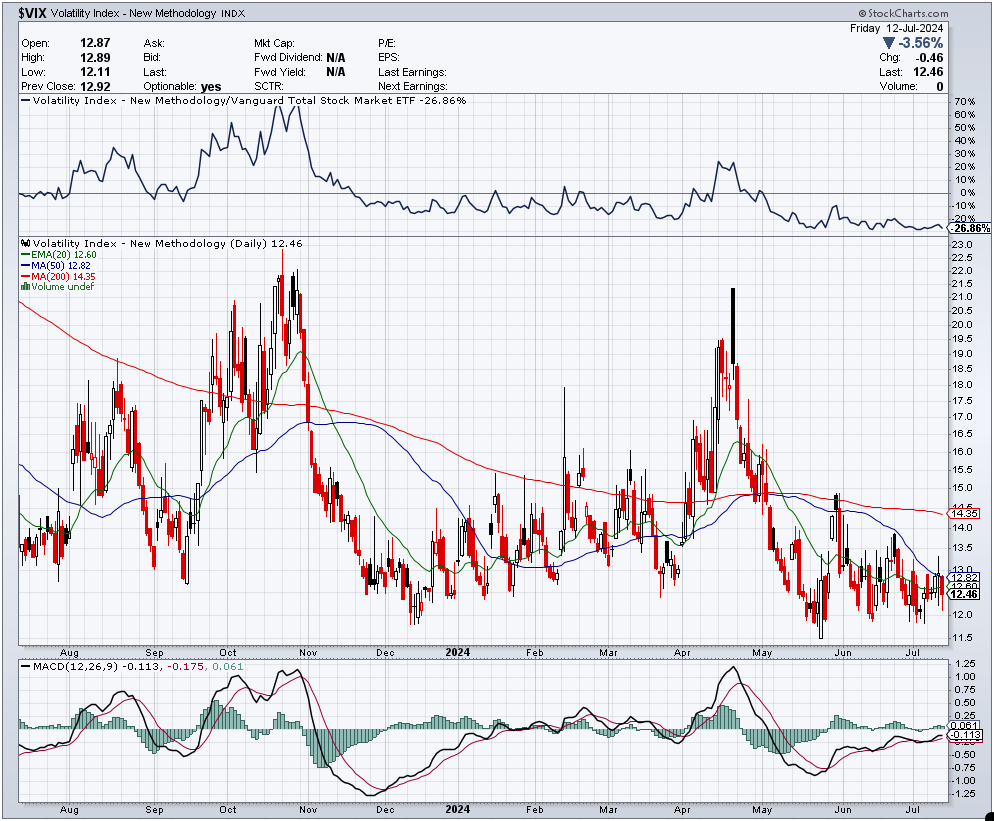
In terms of volatility? Seems like every day I look at my screen I see the VIX trading at a 12 or 13 handle. Remarkably calm and consolidating around the 12.50 level:
One item being tossed around analyst circles is how many days it has been since the last 2% correction in SPY. I pulled the daily closes for 5 years and plotted them against +/- 2% below. Helps to explain the consolidating VIX but I would be remiss not to mention that red line will be breached, just a matter of when.
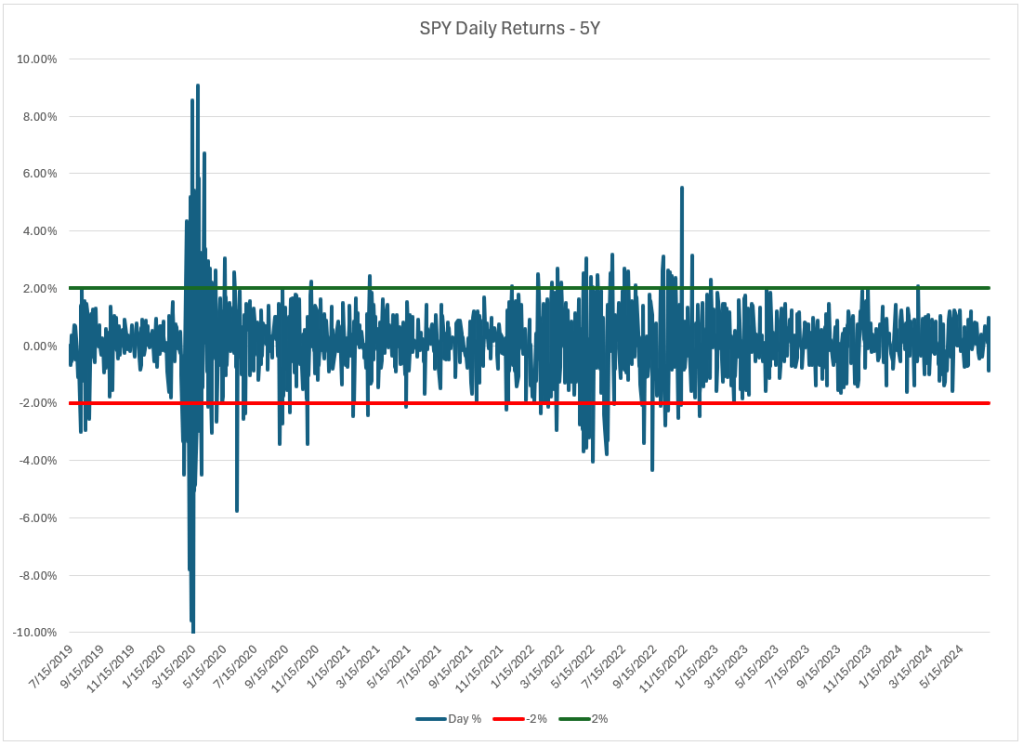
If we can remain in this calm no wake zone moving forward in the second half I will certainly be surprised. After all, it only takes one rouge boat leaning too heavy on the throttle to disrupt the whole harbor.
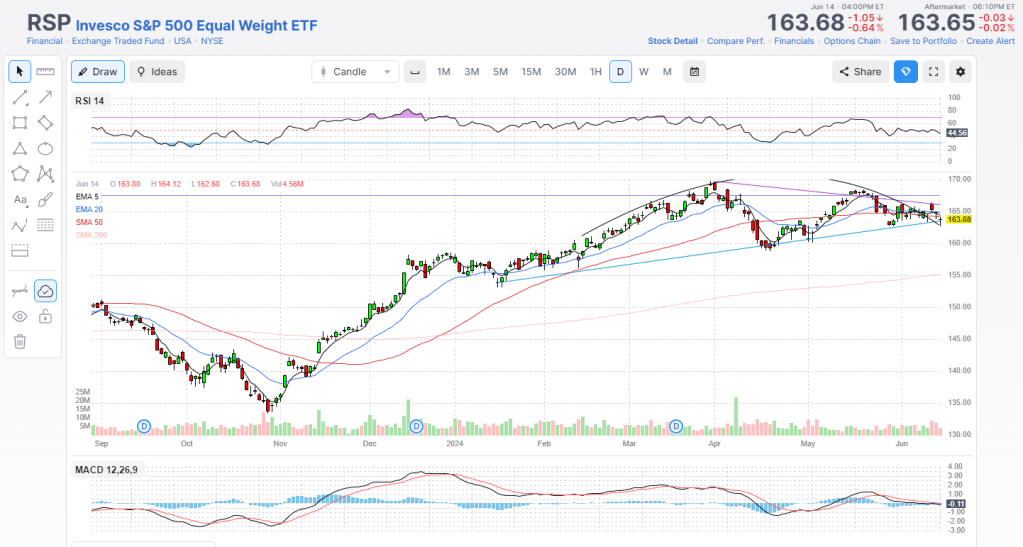
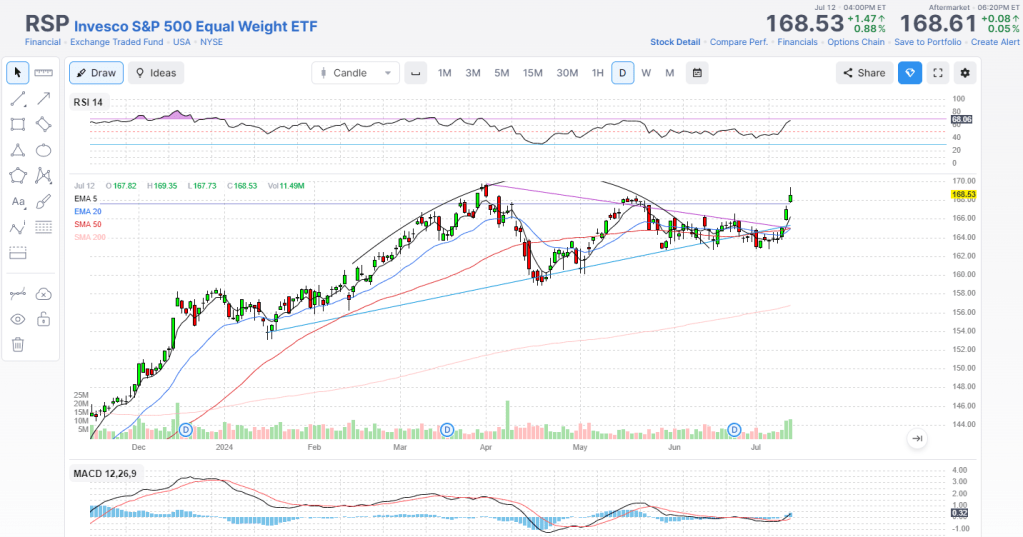
Rotation was the theme from the prior week. Starting with the Equal Weight S&P (RSP), I previously drew in a topping rollover formation that ultimately went sideways before resolving and breaking out to the upside:
Charts via finviz.com
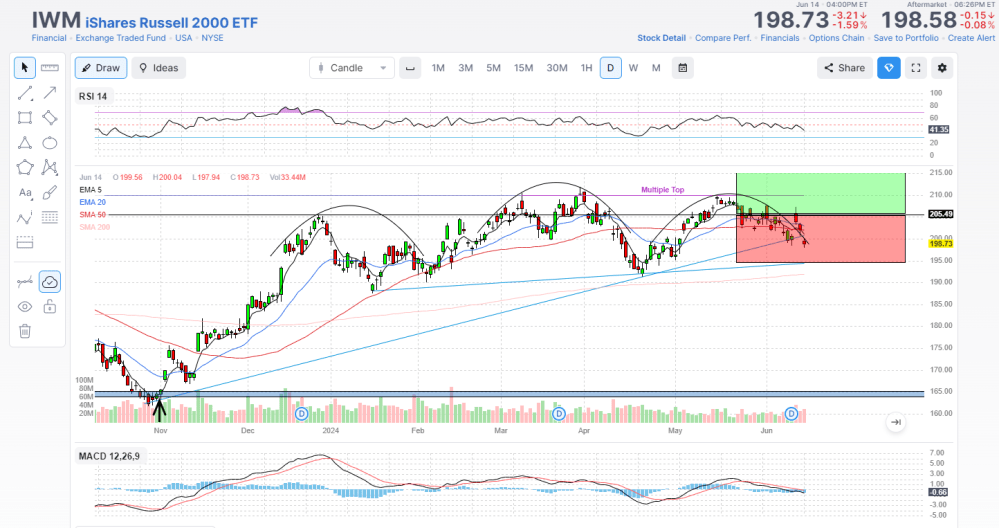
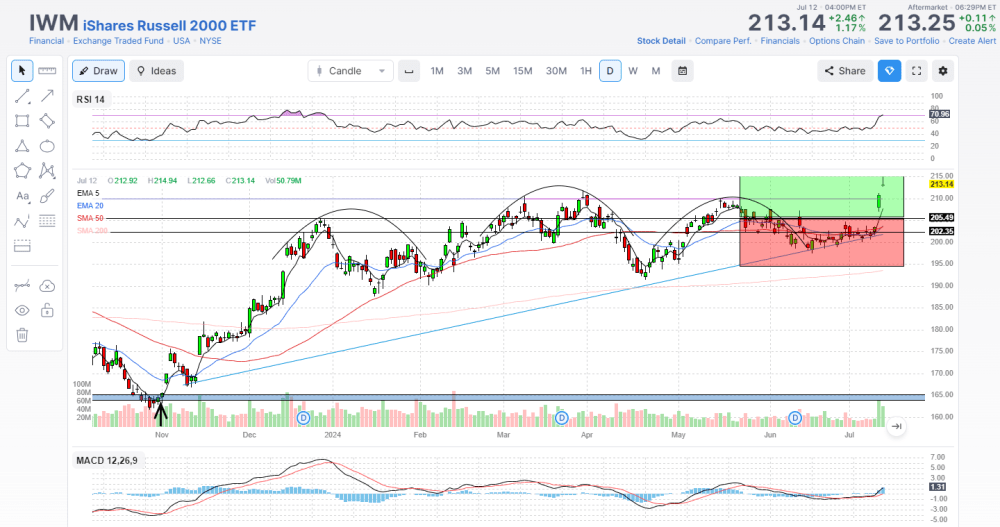
Ditto for Small Caps, the Russell 2000 evaded the Head & Shoulders top by treading water until also breaking out to the upside. Two large gap up days on Thursday and Friday:
Earnings will continue to be front and center this week and the Street will be looking ahead to big tech for follow through and upside guidance.
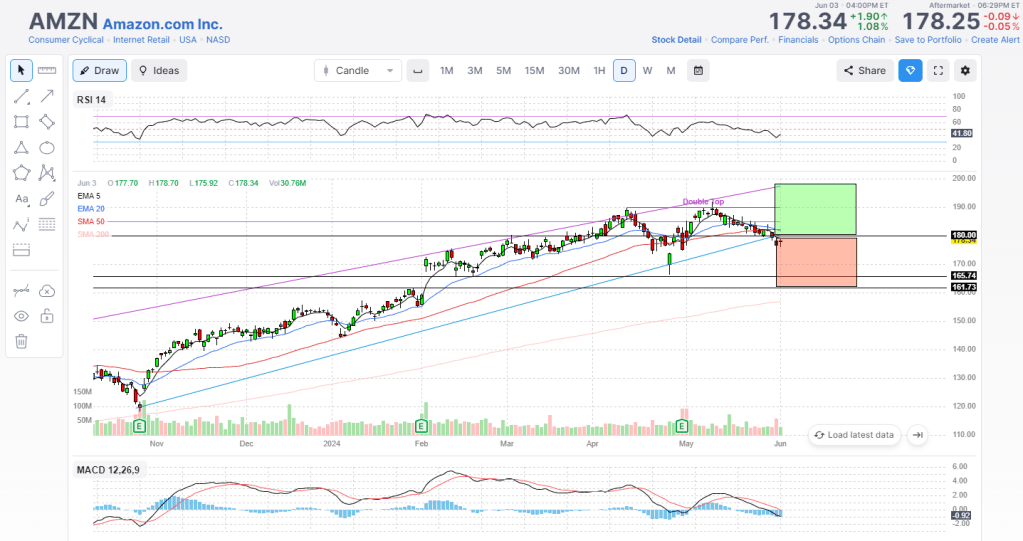
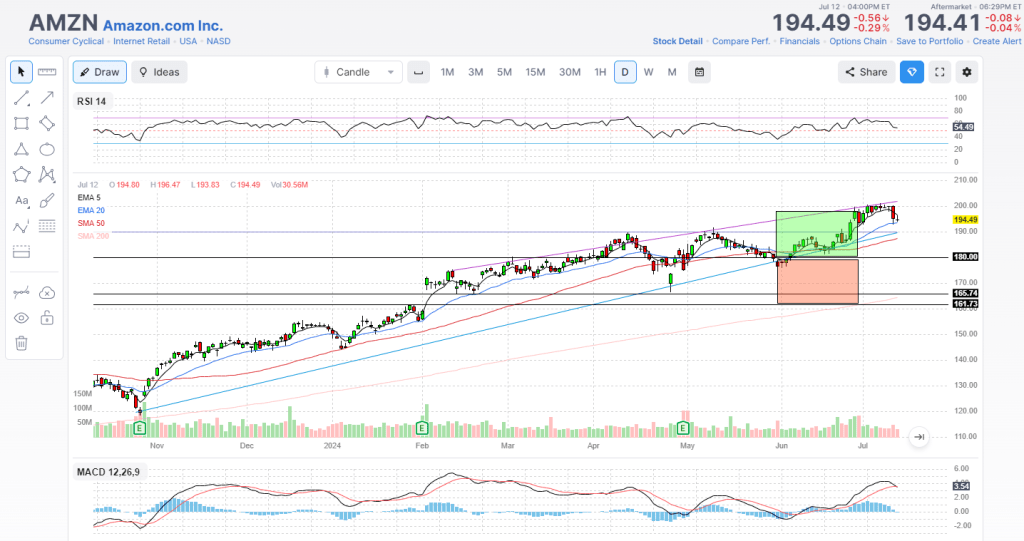
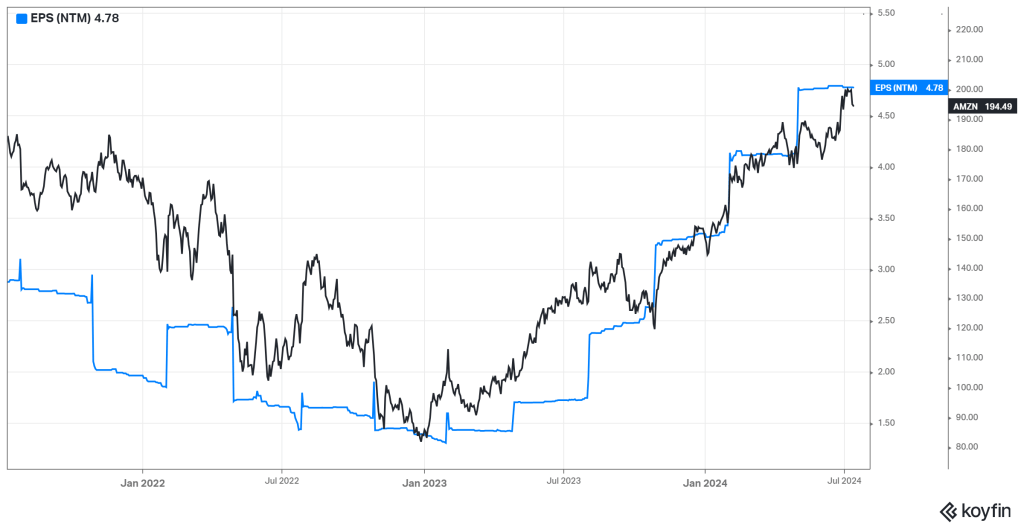
AMZN appeared to be on the verge of a breakdown/breakout in early June, I drew in some possible ranges to watch and as you can see it was able to remain in the up channel and it continues to test the top of that range:
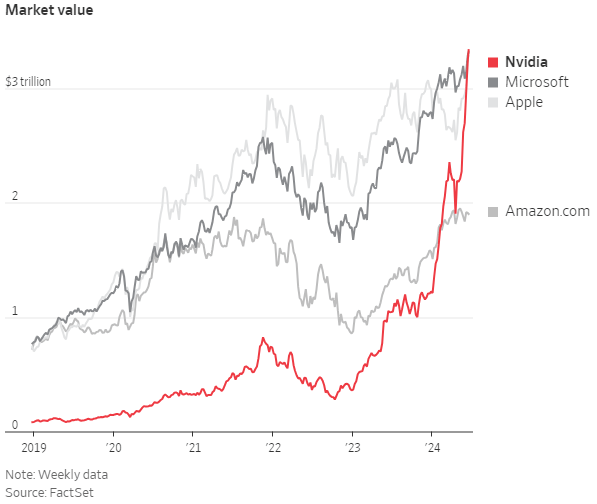
I look for AMZN to ultimately close this market cap gap visible below between itself and fellow MAGs:
One last thought on forward earnings and price action, the link between the two clearly demonstrated by one of my favorite Koyfin tools, the Estimates Overview which overlays price vs. EPS (NTM). Note the correlation. Not hard to imagine $220 plus for AMZN if this trend and correlation continues:
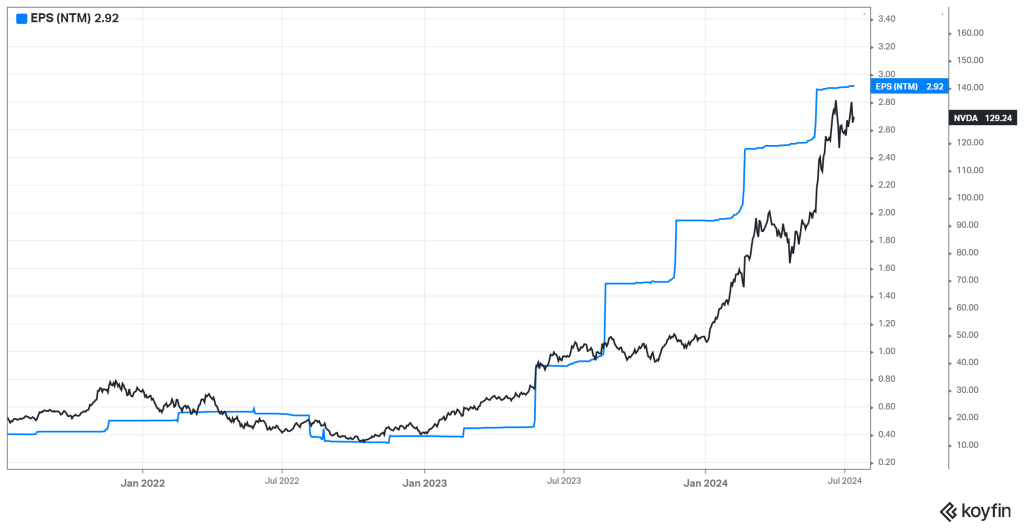
Is NVDA overvalued? Not so much when viewed in the exact same context. If they are able to continue to revise future earnings up, price should inevitably follow?
That will do for now.
It’s been a long week followed by an even longer weekend in terms of news flow. That news flow is only getting started, calm before the storm if you will.
Reminder to check out my Calendar in the main menu for upcoming economic events of interest. I will keep these updated with actuals vs. expectations as they come in.
Have a good week.