

5/20/50/200
More on those numbers in a few, but first a little background.
“Reversion…” or “Regression to the Mean” dates back to the 1880’s. The phrase itself is credited to one Sir Francis Galton. He was doing a study on height, more specifically the variance of children’s height compared to parents and other offspring.
It was ultimately proved to be invalid but I will stop there. Thank me later.
From a Finance Stance, said Sir Francis’ reversion can be applied to any metric you choose, from individual stocks, sectors or even much larger macro indicators:
In terms of overall price action, this is a much simpler view:

Markets are complicated enough, so I have learned over the years to keep it simple anytime I am offered that opportunity.
That said, I think it’s worth a look at where we are today compared to some moving averages and since I call the shots here, I will use my four preferred timeframes:
5 day EMA / 20 day EMA / 50 day SMA / 200 day SMA
I prefer exponential moving averages on shorter timeframes (less than one month) because they are more reactive to recent pricing. In other words they will more heavily weight recent prices.
My preferred “go long” indicator is a 5/20 EMA cross, when the 5 day EMA crosses above the 20 day EMA. It indicates strong short-term momentum that is overtaking a recent medium term trend.
Zooming out beyond one month, I will use the standard simple moving average. If anyone refers to a 50 day or 200 day moving average, you can be 99.9% certain they are referring to the simple version.
Given the recent face ripper rally that started in November, the macro uncertainty, the geopolitical uncertainty…I think it would be a useful exercise to “keep it simple” and see exactly where we stand?
Doc?
Indeed sir. You may proceed.
I will be using the widely traded and broader market tracking SPY for this exercise.
5/20 EMA Cross

SELL/NEUTRAL signal on Oct 18 @ 428.47 close. SPY would bottom at 407.56 on Oct 27th (-4.9% lower).
BUY signal on Nov 3 @ 432.93 close. Two close calls on Jan 5 and Jan 17 but the 5 day EMA never crossed below the 20. As of today, Feb 7, the buy signal remains fully intact at a close of 498.10 (+15.2% higher).
50/200 SMA
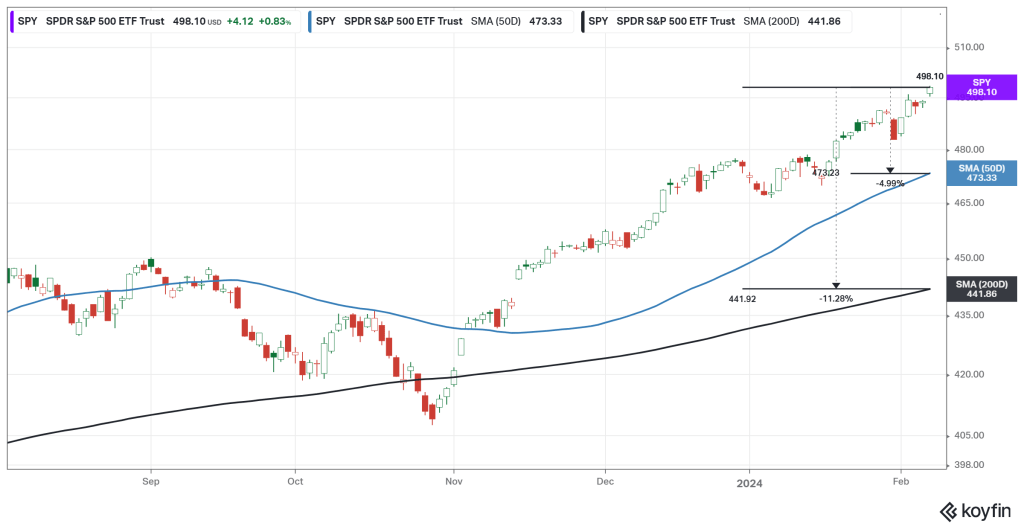
Zooming out to the 50 and 200 day SMA, you can see we closed above the 50 day on Nov 3 and have not looked back. Our last visit below the 200 day was pre-Halloween 2023.
Tracing today back to those levels: -5% to the 20 and -11%+ to the 200.
SO NOW WHAT?
Whether you are a short term trader or long term investor, or both, it’s good to know where the overall market stands in relation to these levels.
There is no magic formula that derived the 5/20 EMA and 50/200 SMA for me personally, other than 25+ years settling in on what works and what doesn’t. It may be totally different for you. So be it.
As for me when I see the broader market start to accelerate and pull away from these levels, I start to get much more tactical, much more methodical.
I purchased some value leaning dividend payers today and nibbled on some March SPY put options just in case the music stops anytime soon.
I read the print version of the WSJ each morning.
It’s a habit, it’s a routine and I enjoy it.
When I eventually get to the market data, the first thing I migrate to is the S&P graph and where it stands against the 65 day moving average.
I have NO CLUE why the WSJ uses the 65 day. Month / Half? Oh well, to each his own.
All I know is at some point in the future, if I see the line pulling away to the upside (or downside), it will only be a matter of time…
…until we round trip…
…until it “reverts to the mean”.

Thanks for reading…
