
The world started the week reeling from the terror attacks in Israel and ended it scratching heads at the state of the GOP.
I think back to this interview, which sums up everything you need to know about the state of affairs in Washington:

Unfortunately if these yaps cannot check the first few simple boxes of a functioning democracy, we may be enduring more shutdown talk by mid November.
The markets are broken, from a technical perspective, no other way to put it. That said, should this pullback remain orderly and consolidate sideways it could turn out to be healthy.
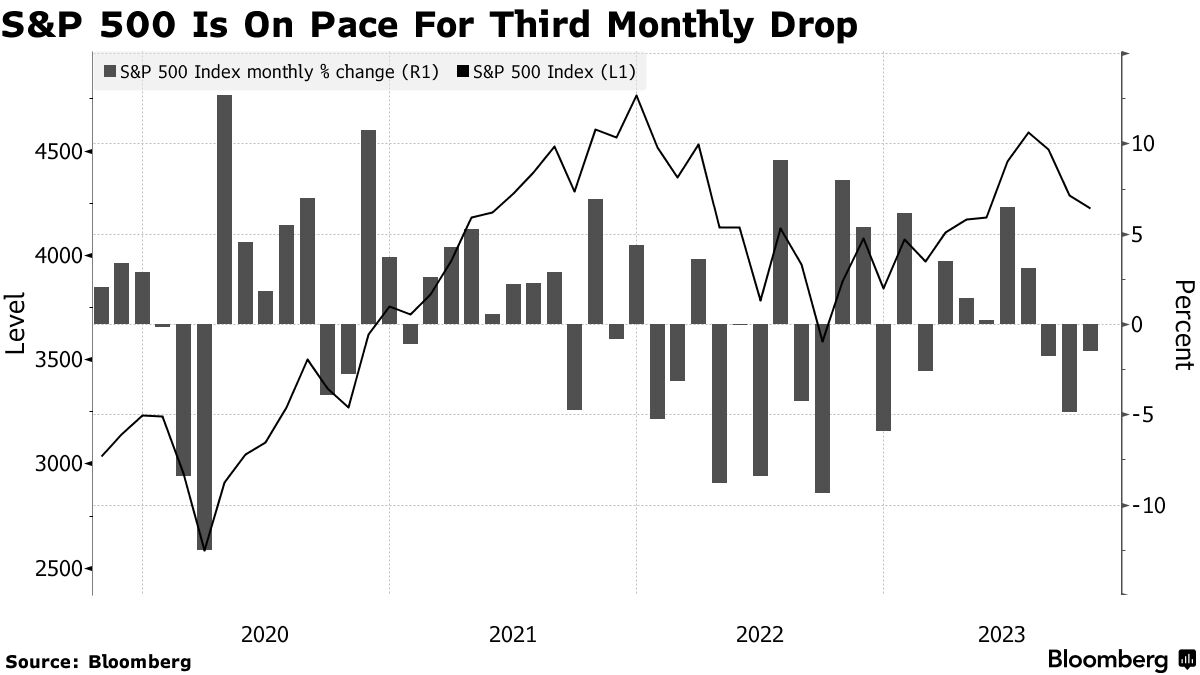
The recent run-up was not sustainable, not with this geopolitical backdrop and inflation flirting with possible re-acceleration. Too many unknowns and we are heading toward another down month on SPY:
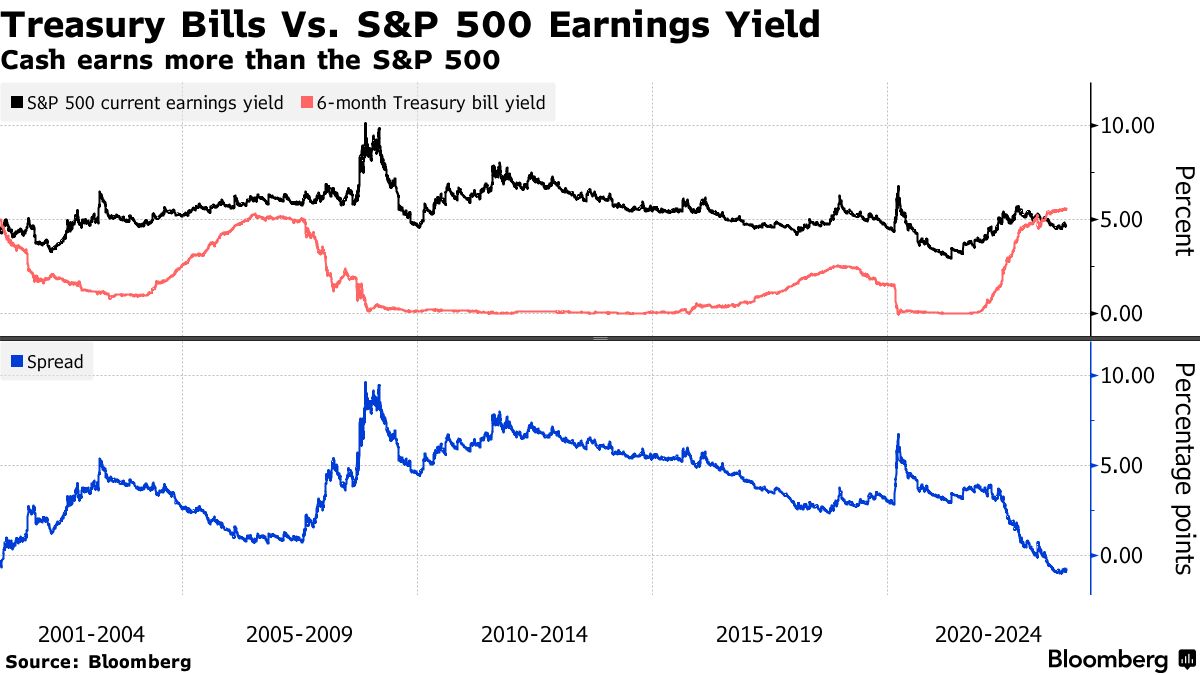
With cash earning 5%, I am admittedly sort of in “deer in headlights” mode right now in my short-term accounts. I am much more tactical and allocating smaller amounts, it’s just a tougher decision to “re-risk” capital.
As of today, 86 of the S&P 500 companies have reported, 73% of those were “beats” and the average upside surprise was a tick under 5%.
The companies reporting over the next few weeks may hold the key to a year end rally. If tech beats big and more importantly raises or confirms guidance, that could spur upside in Q4. So they better earn baby earn if we hope to see a Santa Claus rally in 2023!
The market also appears primed to punish any lackluster reporters, case in point with Regions Financial getting a 12% haircut on the back side of their announcement.
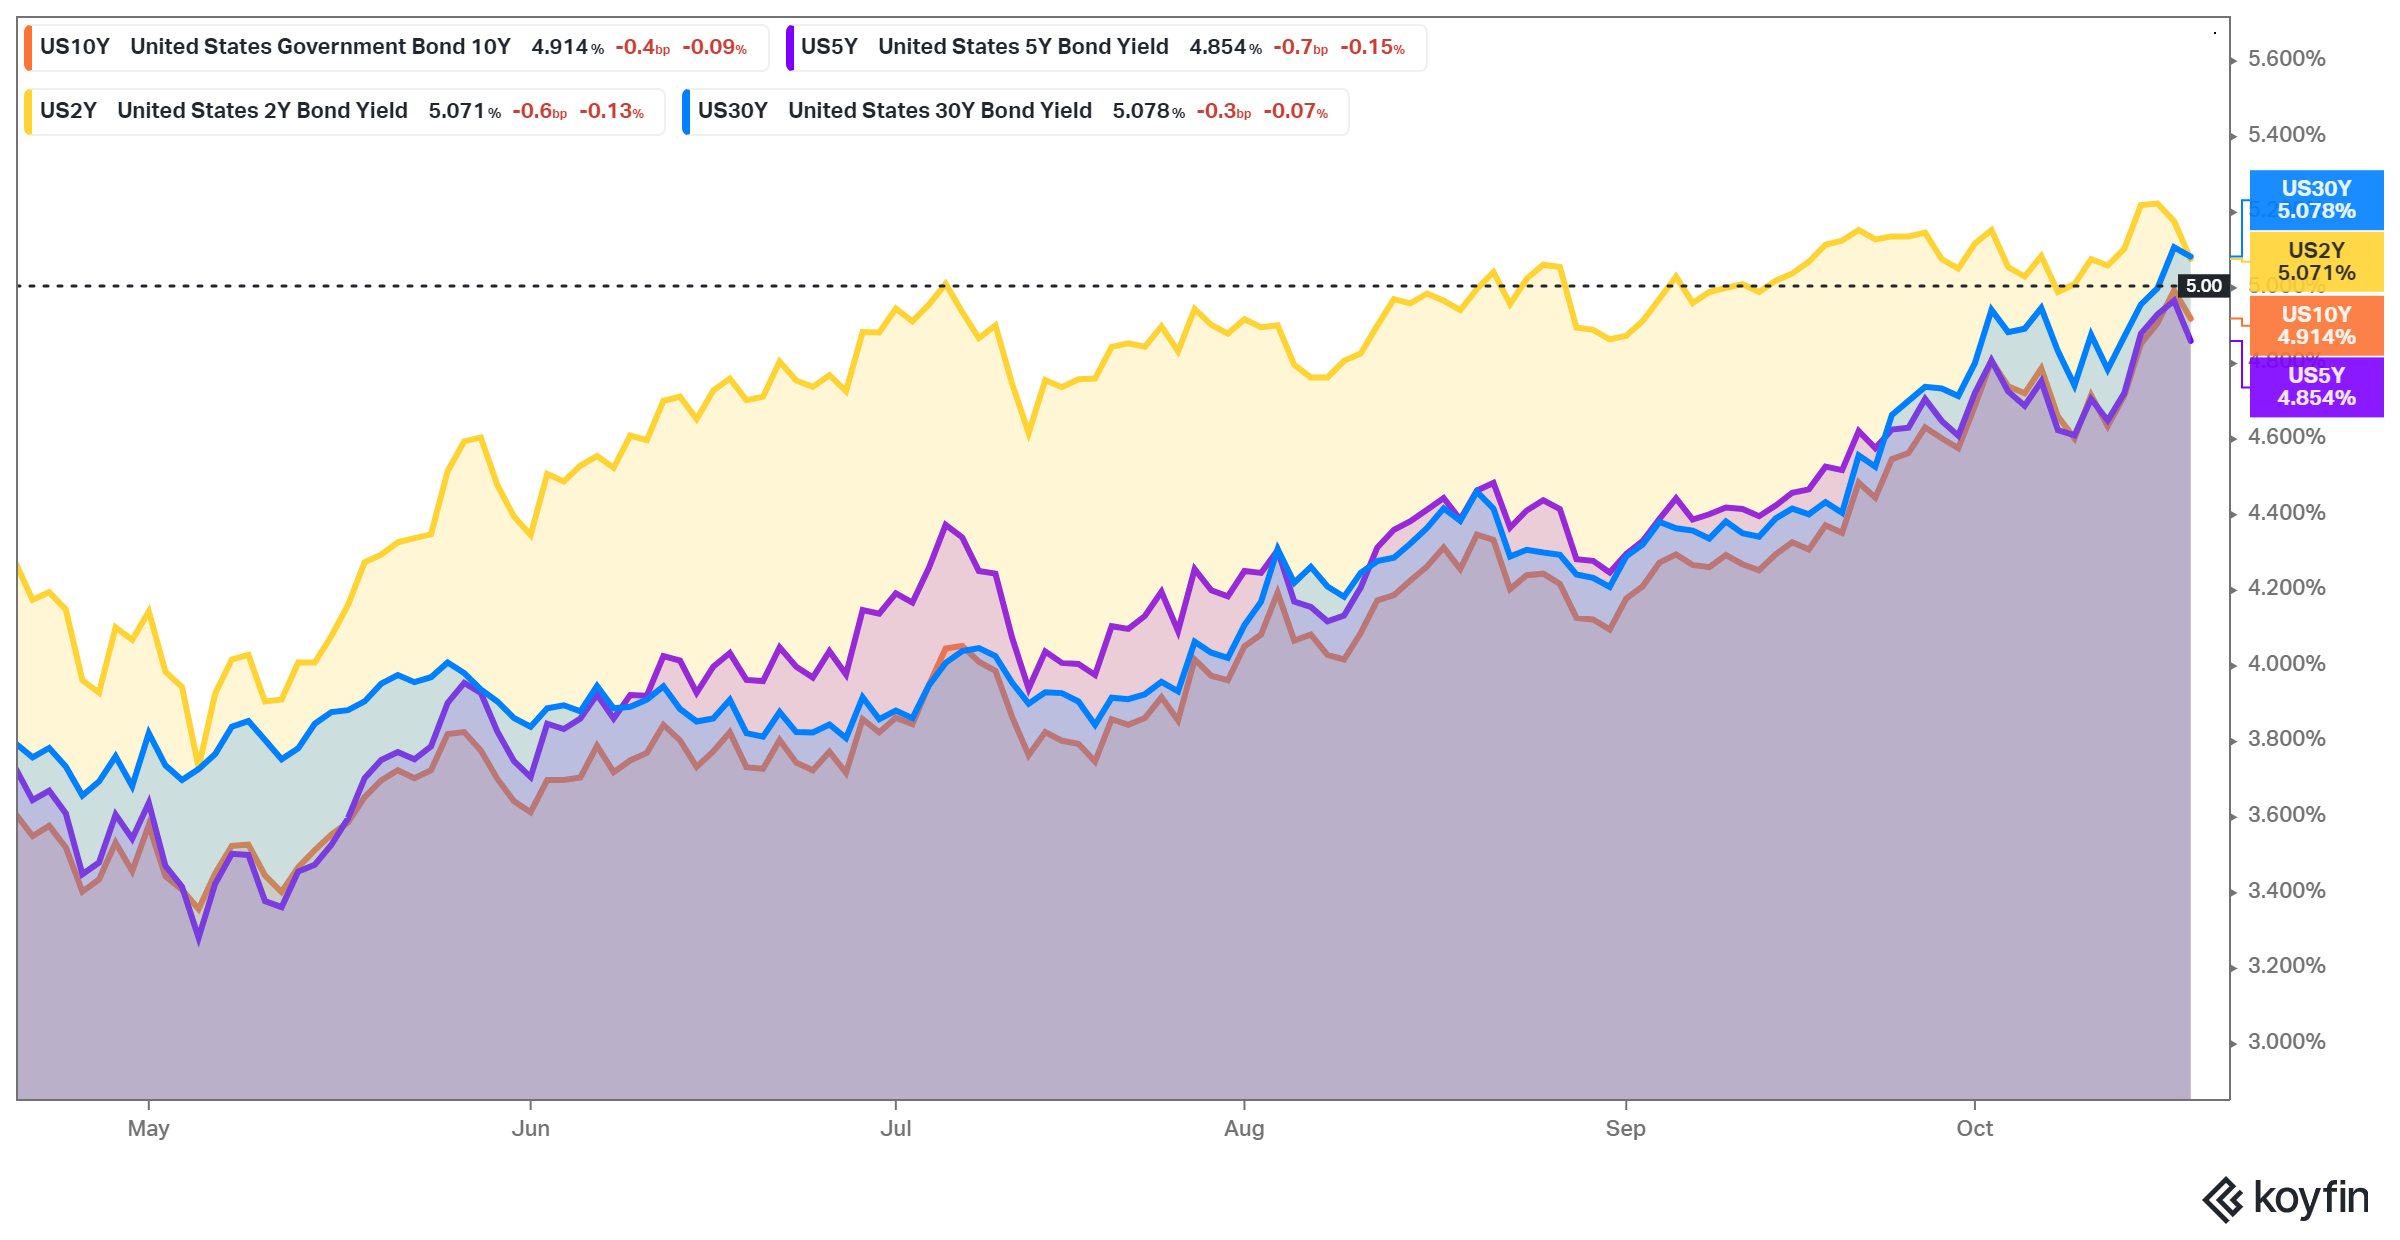
Will the excitement around AI continue? Jury is out, stay tuned. I am hearing a lot of chatter about 4200 being the “floor” for S&P around the 200 day moving average, and 5% on the 10yr being the ceiling as higher for longer gets fully digested.
The consumer has stayed resilient but cracks are forming. Case in point, borrowers are falling behind on car loans at a record pace.
Let’s take a closer look at several different views of what broken looks like…
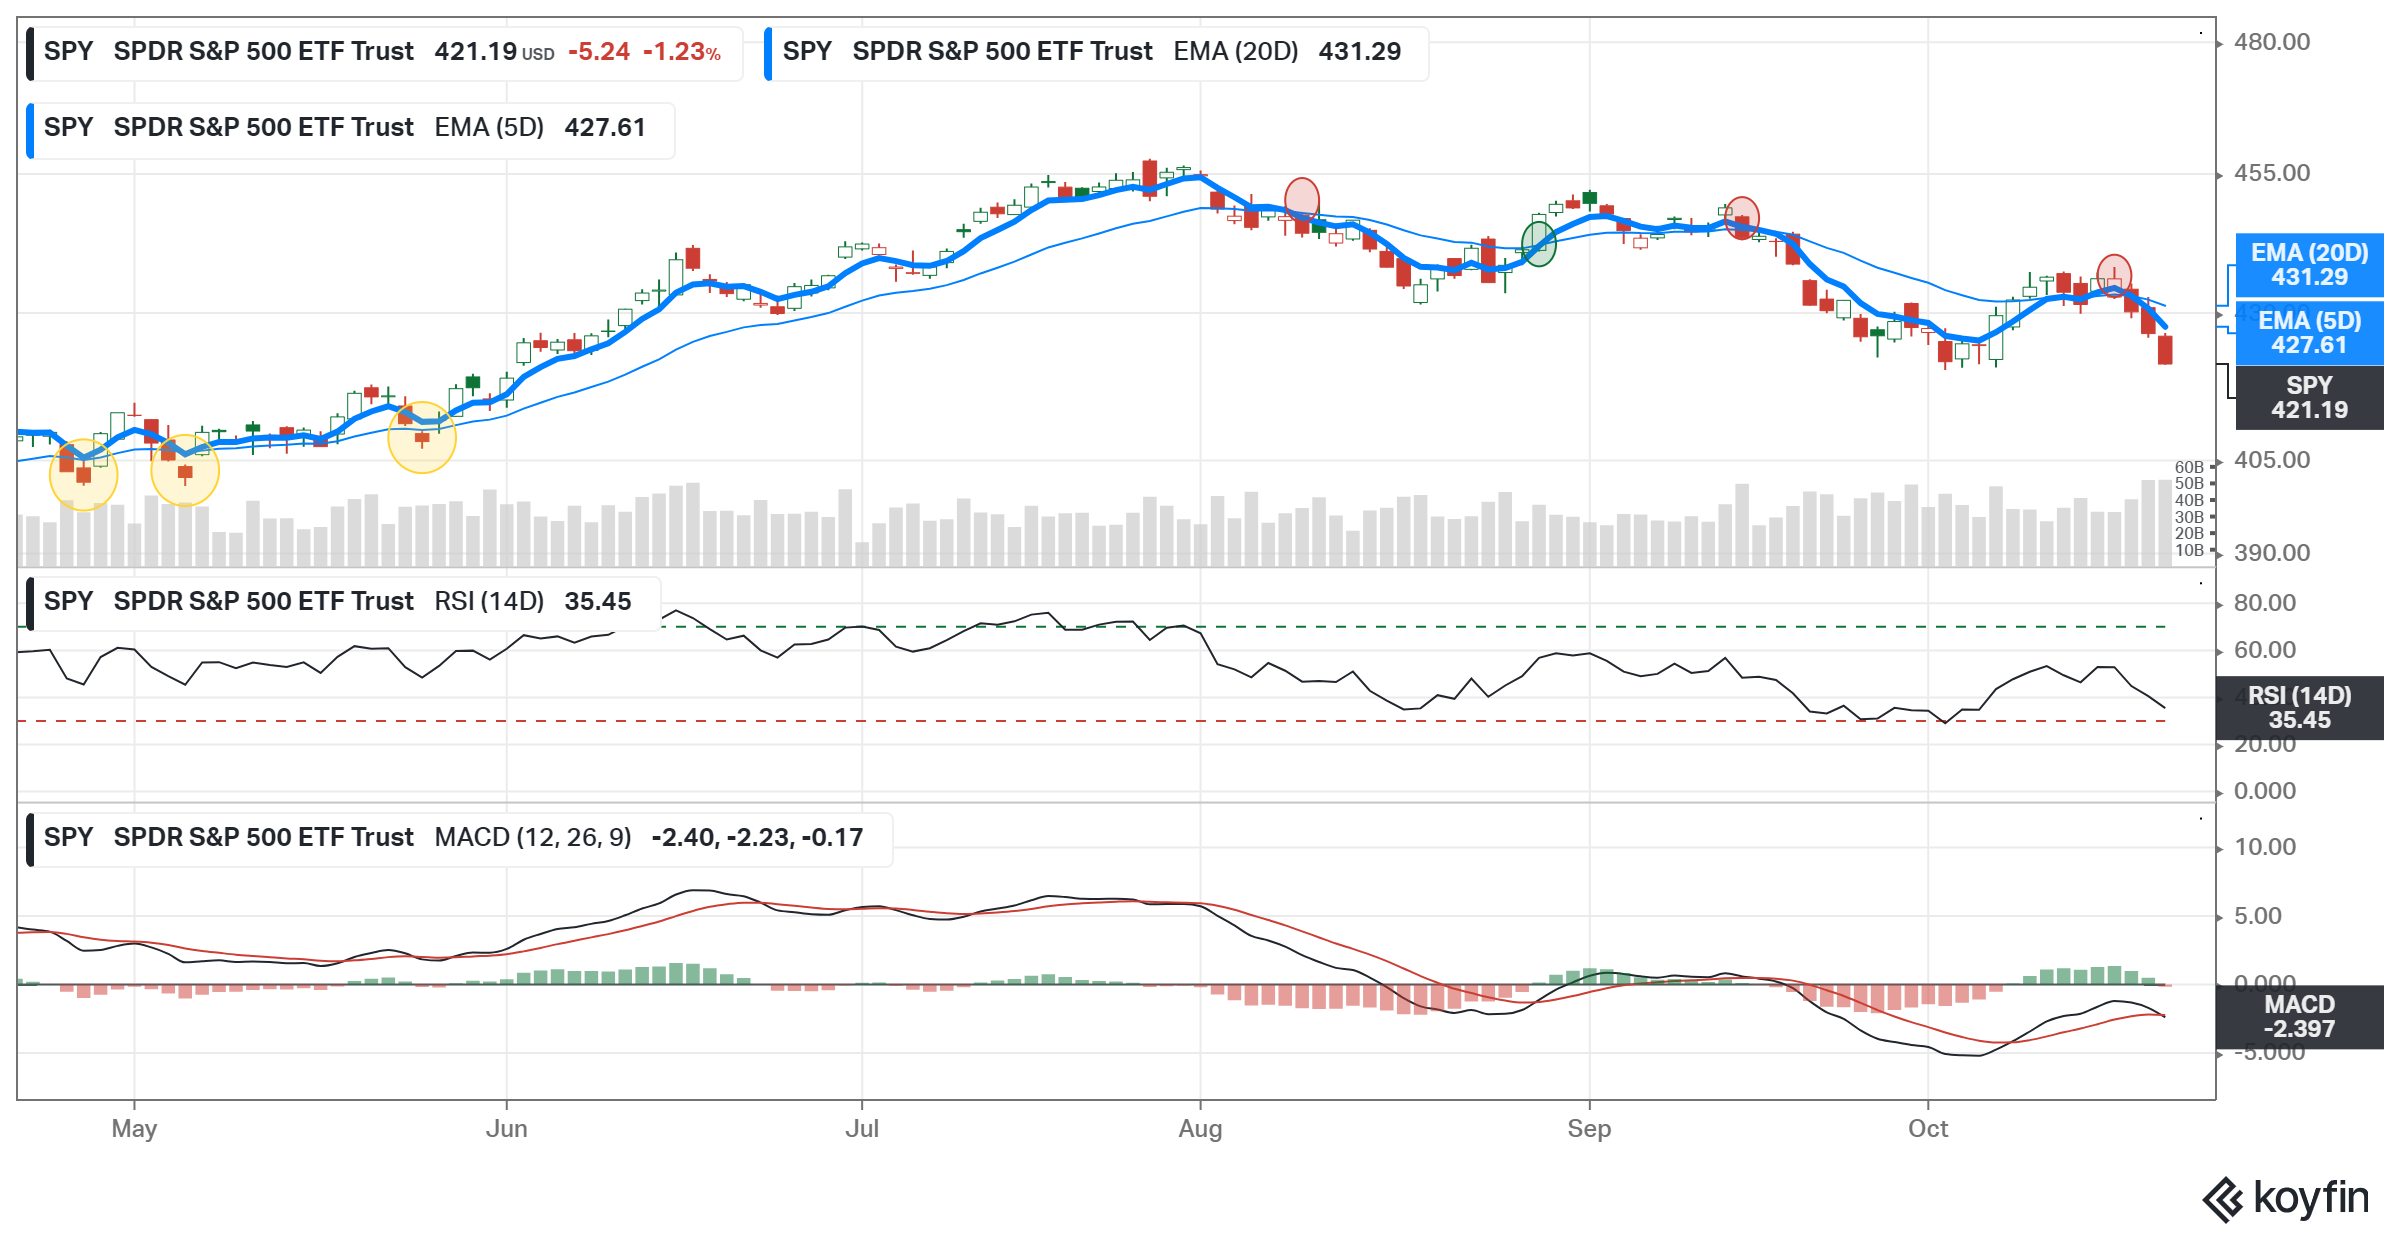
Readers will recall I like to track the 5 day and 20 day EMAs for buy and sell signals. This methodology has proven pretty reliable, buy signal when the 5 crosses the 20 on the upside, sell signal when the 5 crosses the 20 on the downside.
Sell signal intact below and it looks as if it wants to accelerate absent a bid this coming week:
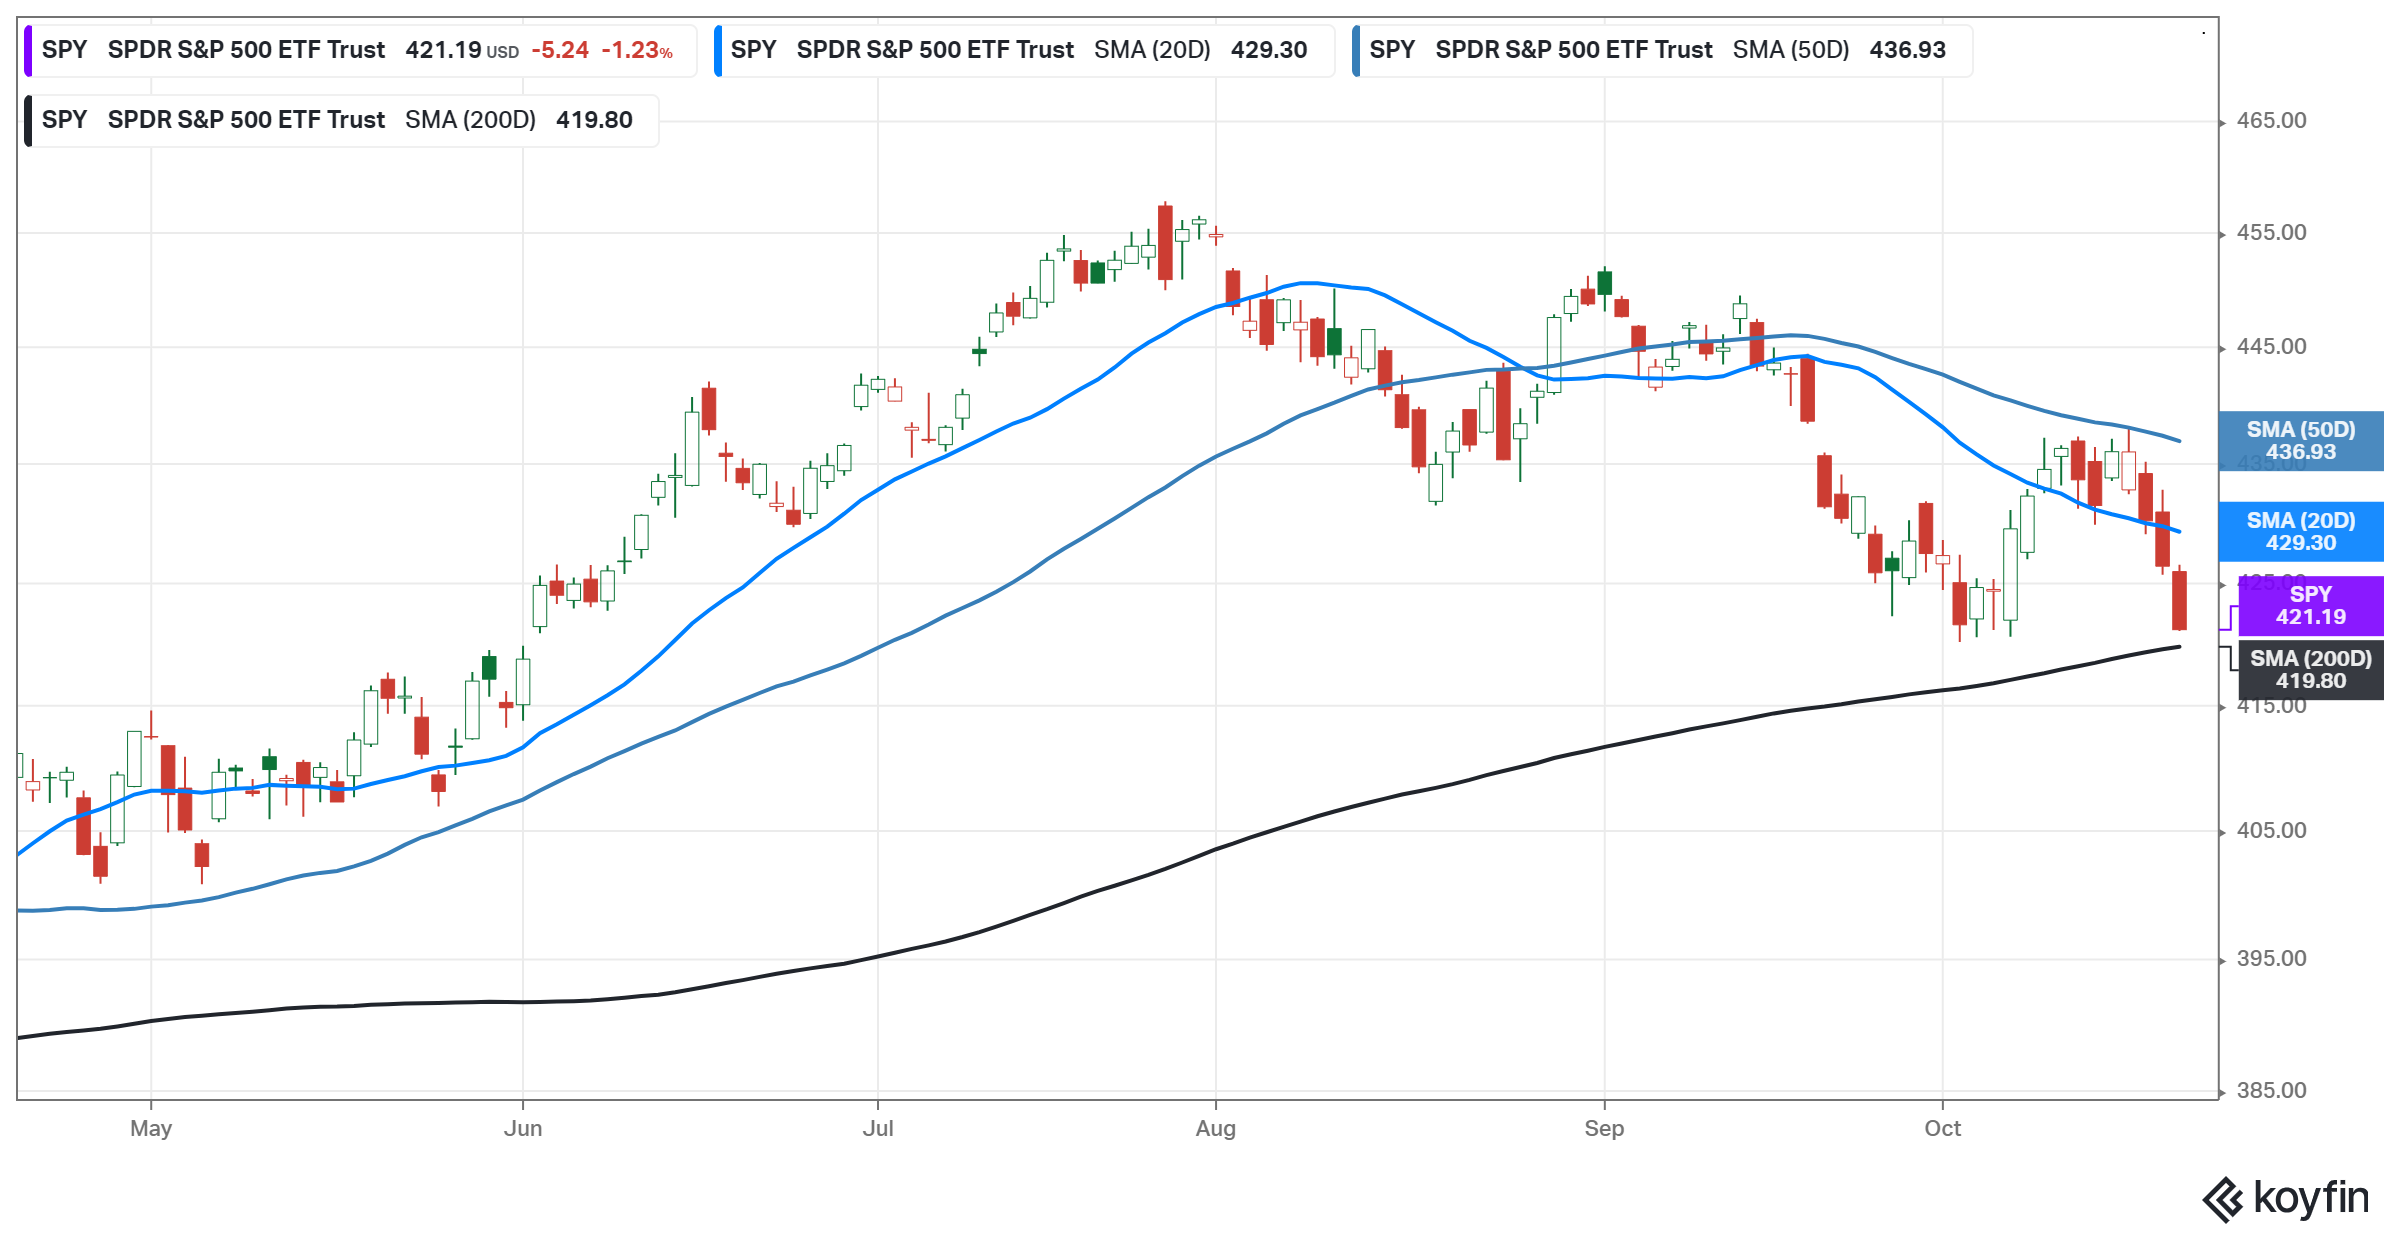
Viewed another way, against the more common simple moving averages, the 200 is now fully in play and it needs to hold:
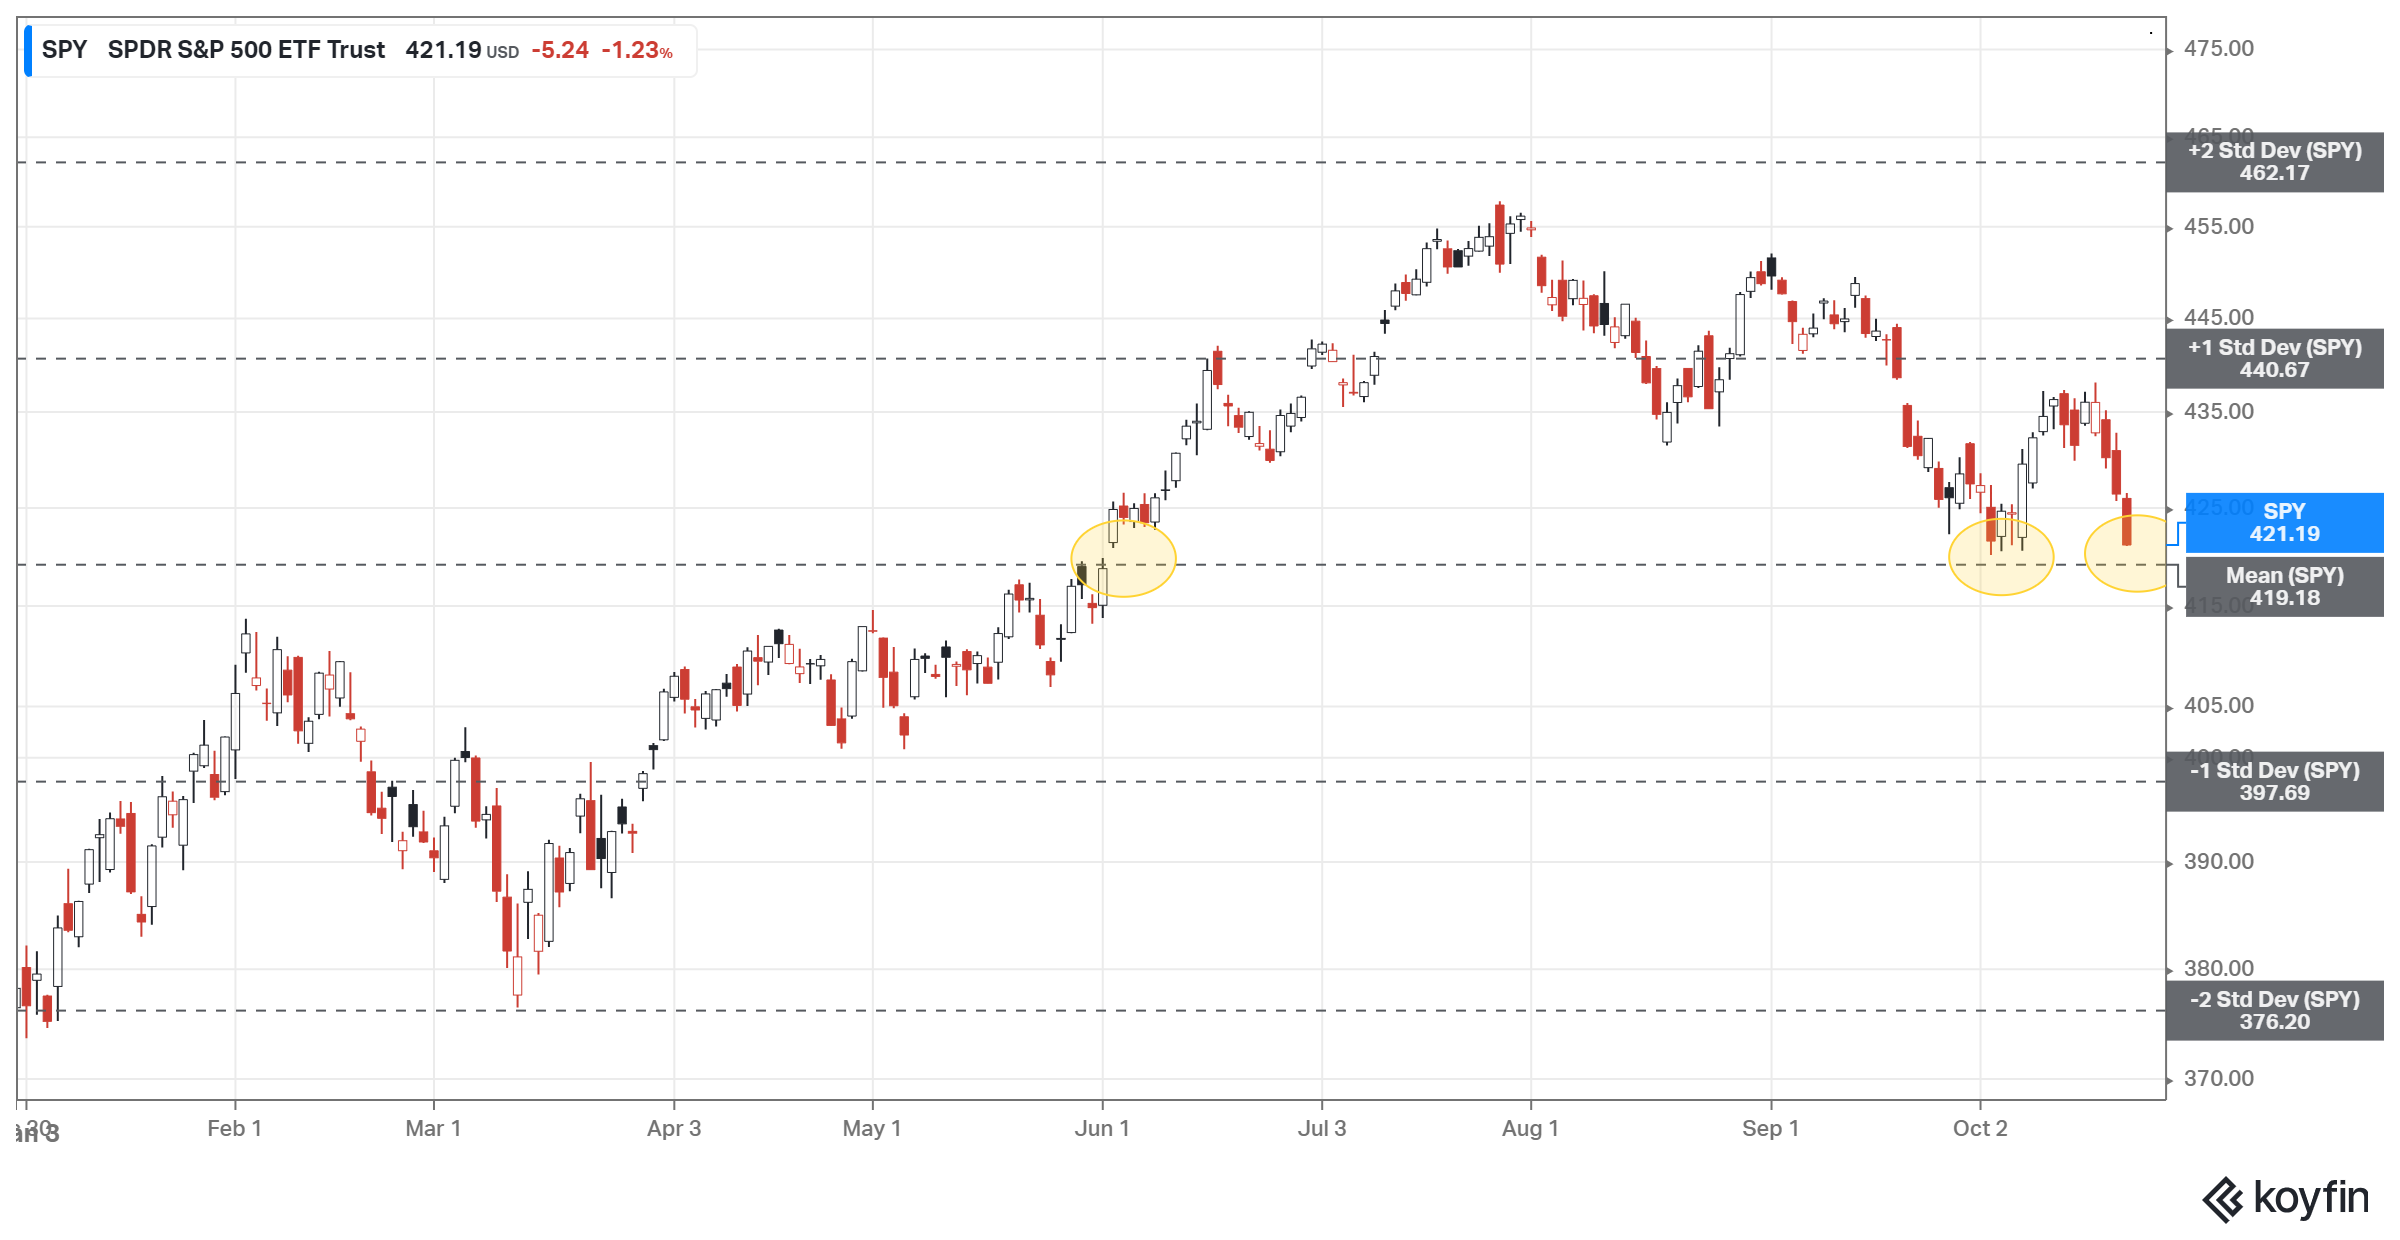
We are back to the level where we gapped up in June, which on a YTD view in terms of +/- 2 standard deviations, we have simply mean reversed. This is probably the best view to support the orderly pullback thesis, it hasn’t been as drastic as it may seem (yet at least):
Small caps aka Russell 2000 or IWM are a disaster. I wonder just how many of these 2000 companies are not earning period and will continue to struggle against the higher rates.
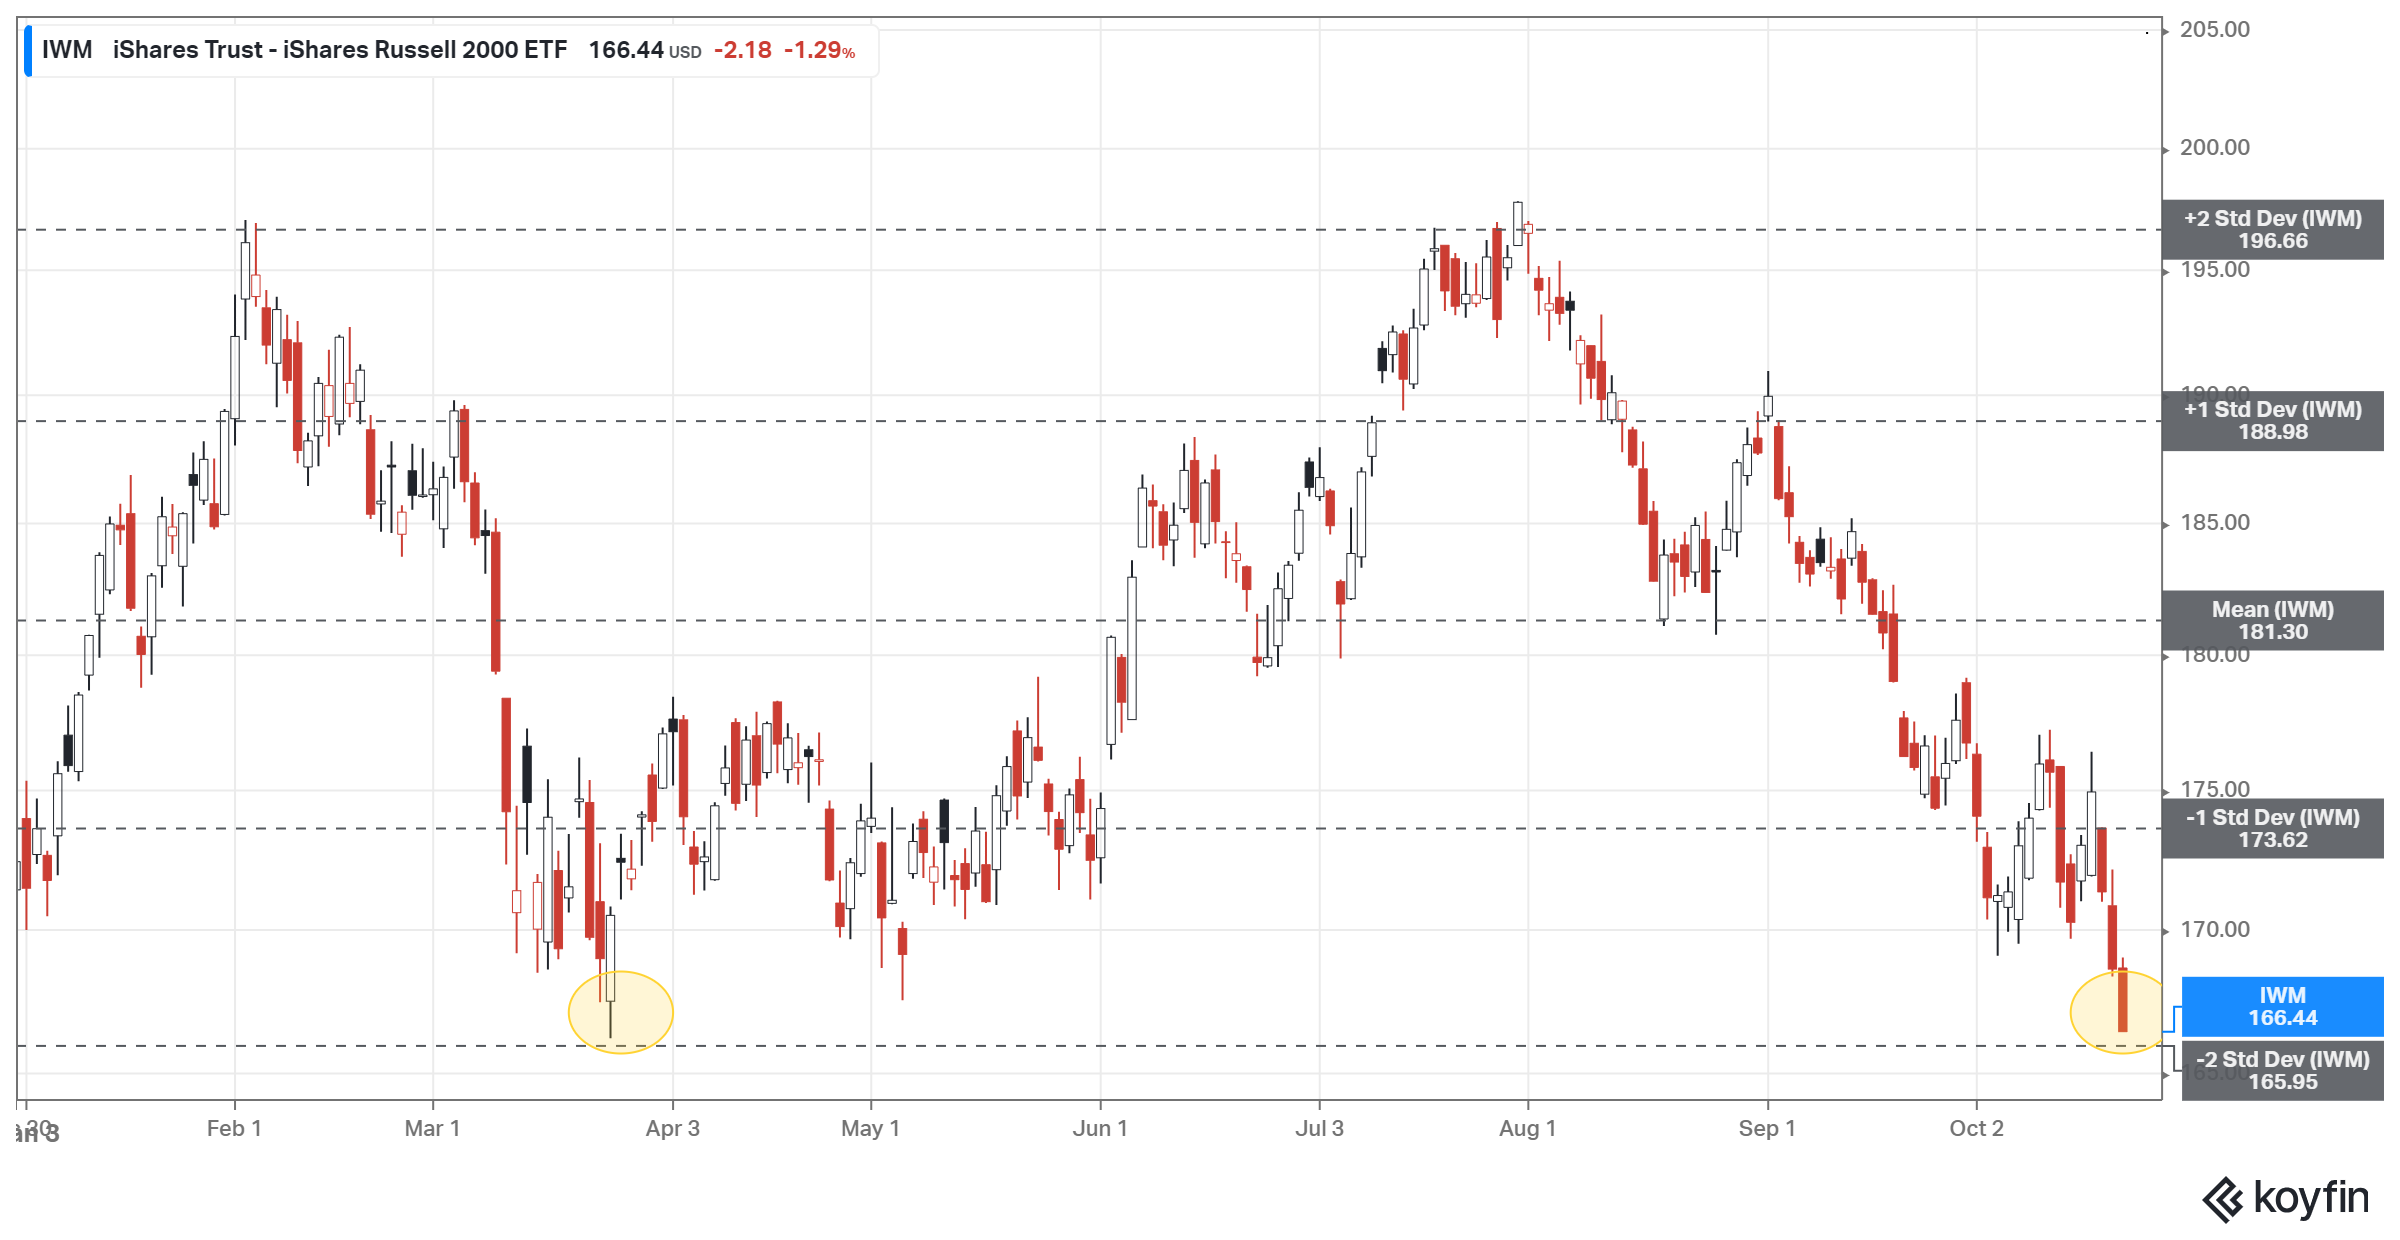
The same standard deviation view of the IWM shows we are knocking on -2, the same level they caught a bid back in late March:
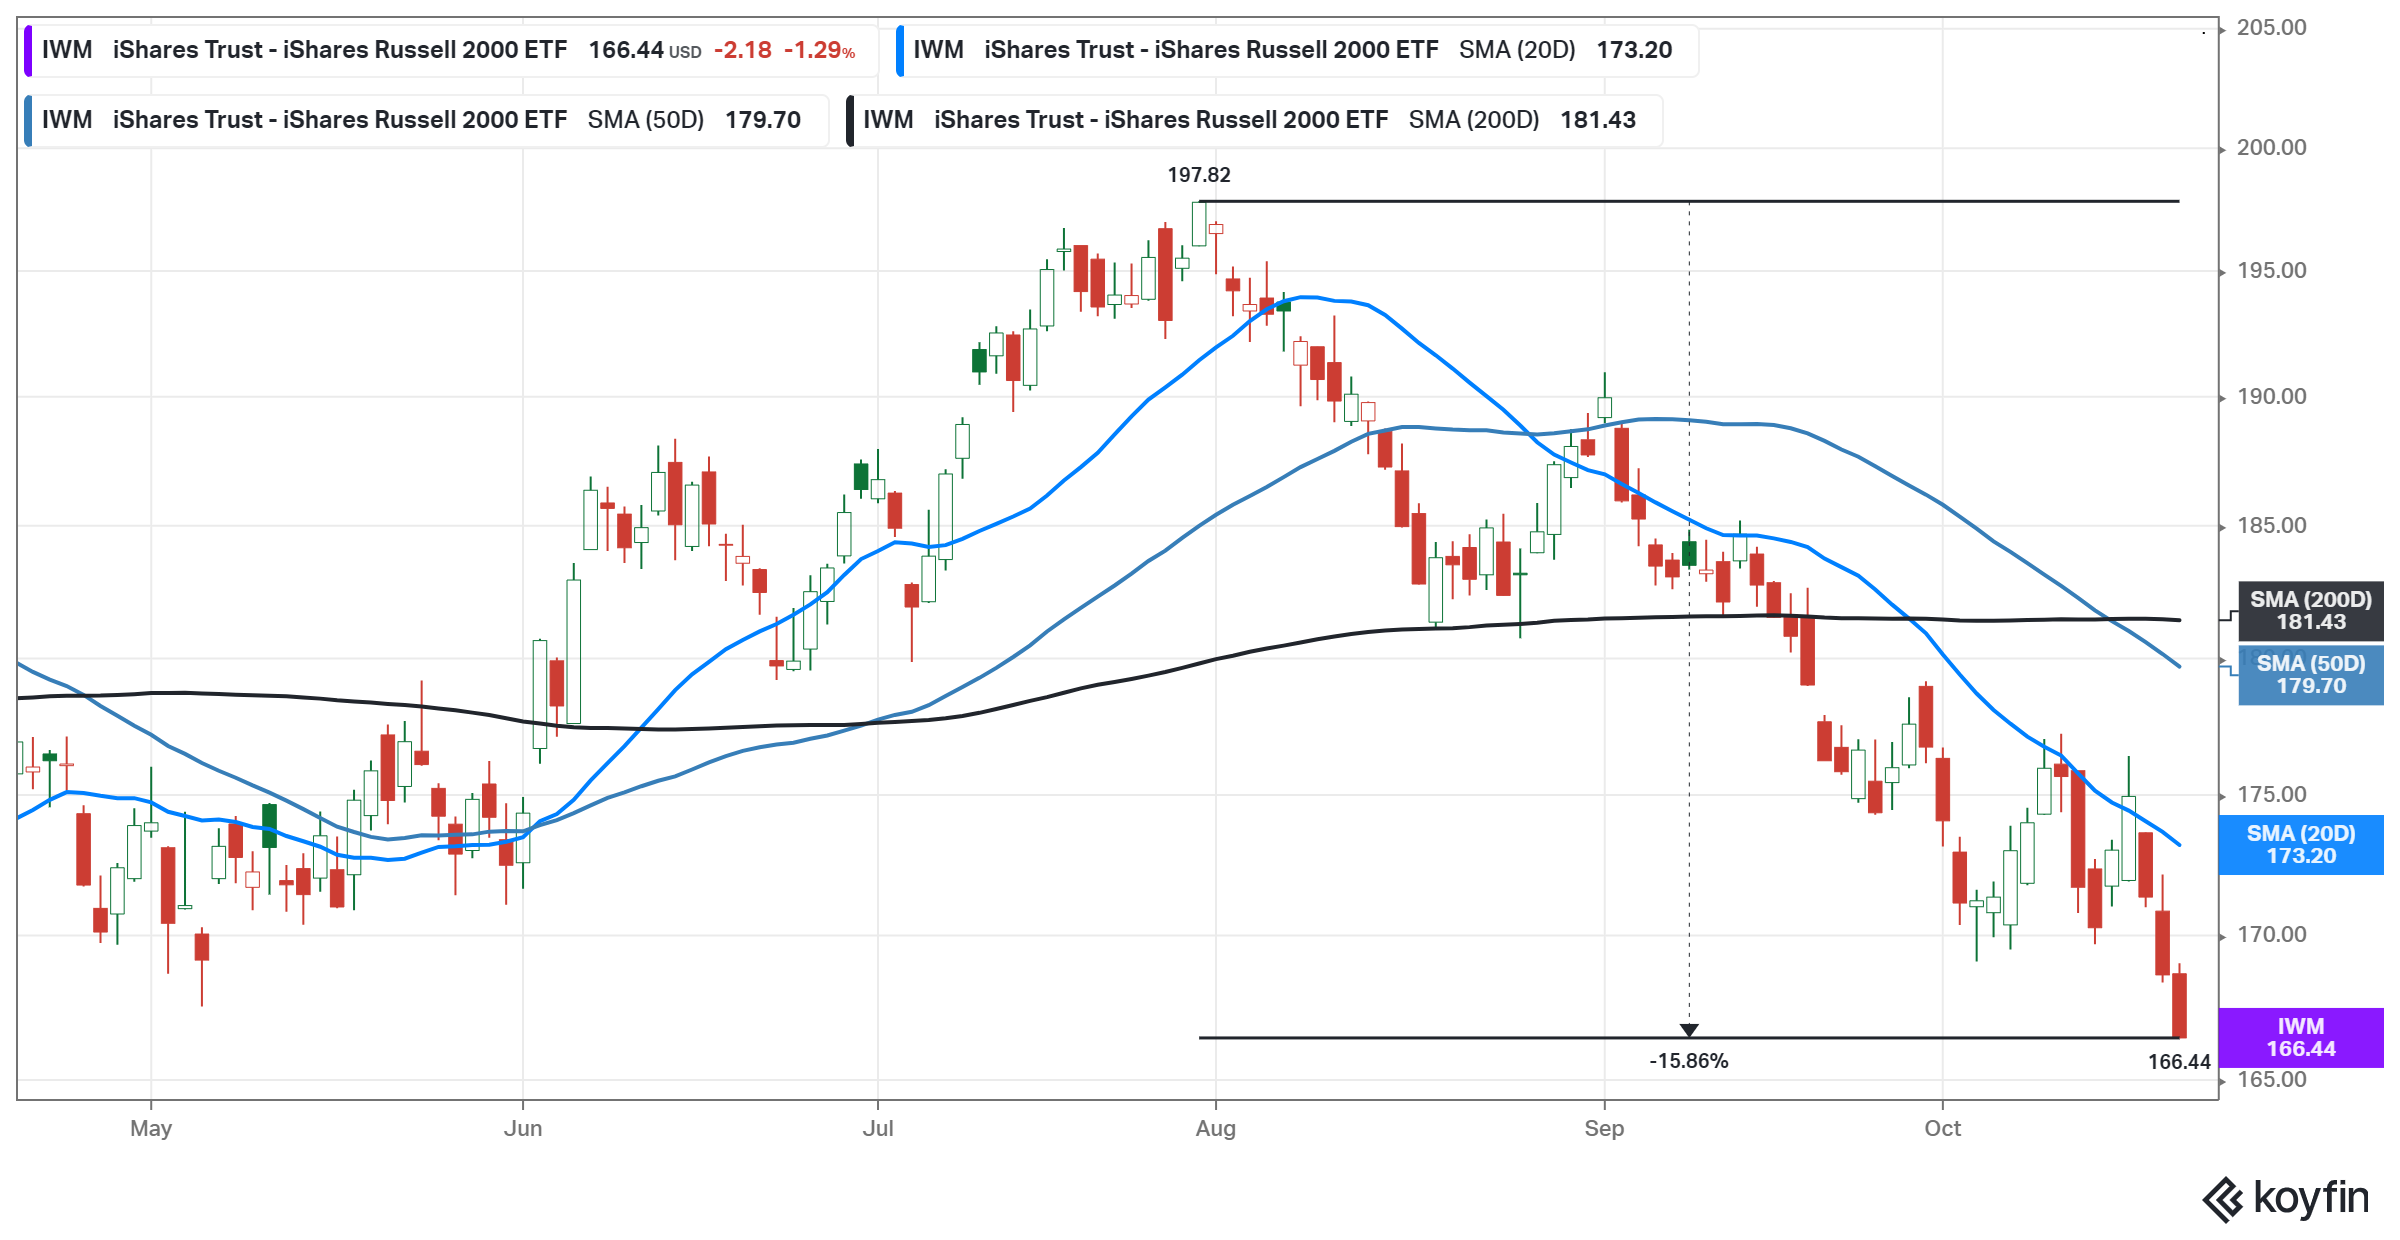
Smalls are down more than 15% off the late July highs:
If you are looking for a chart trending to the upside, I will include a name I have owned from time to time this year and its buy signal is still fully intact:
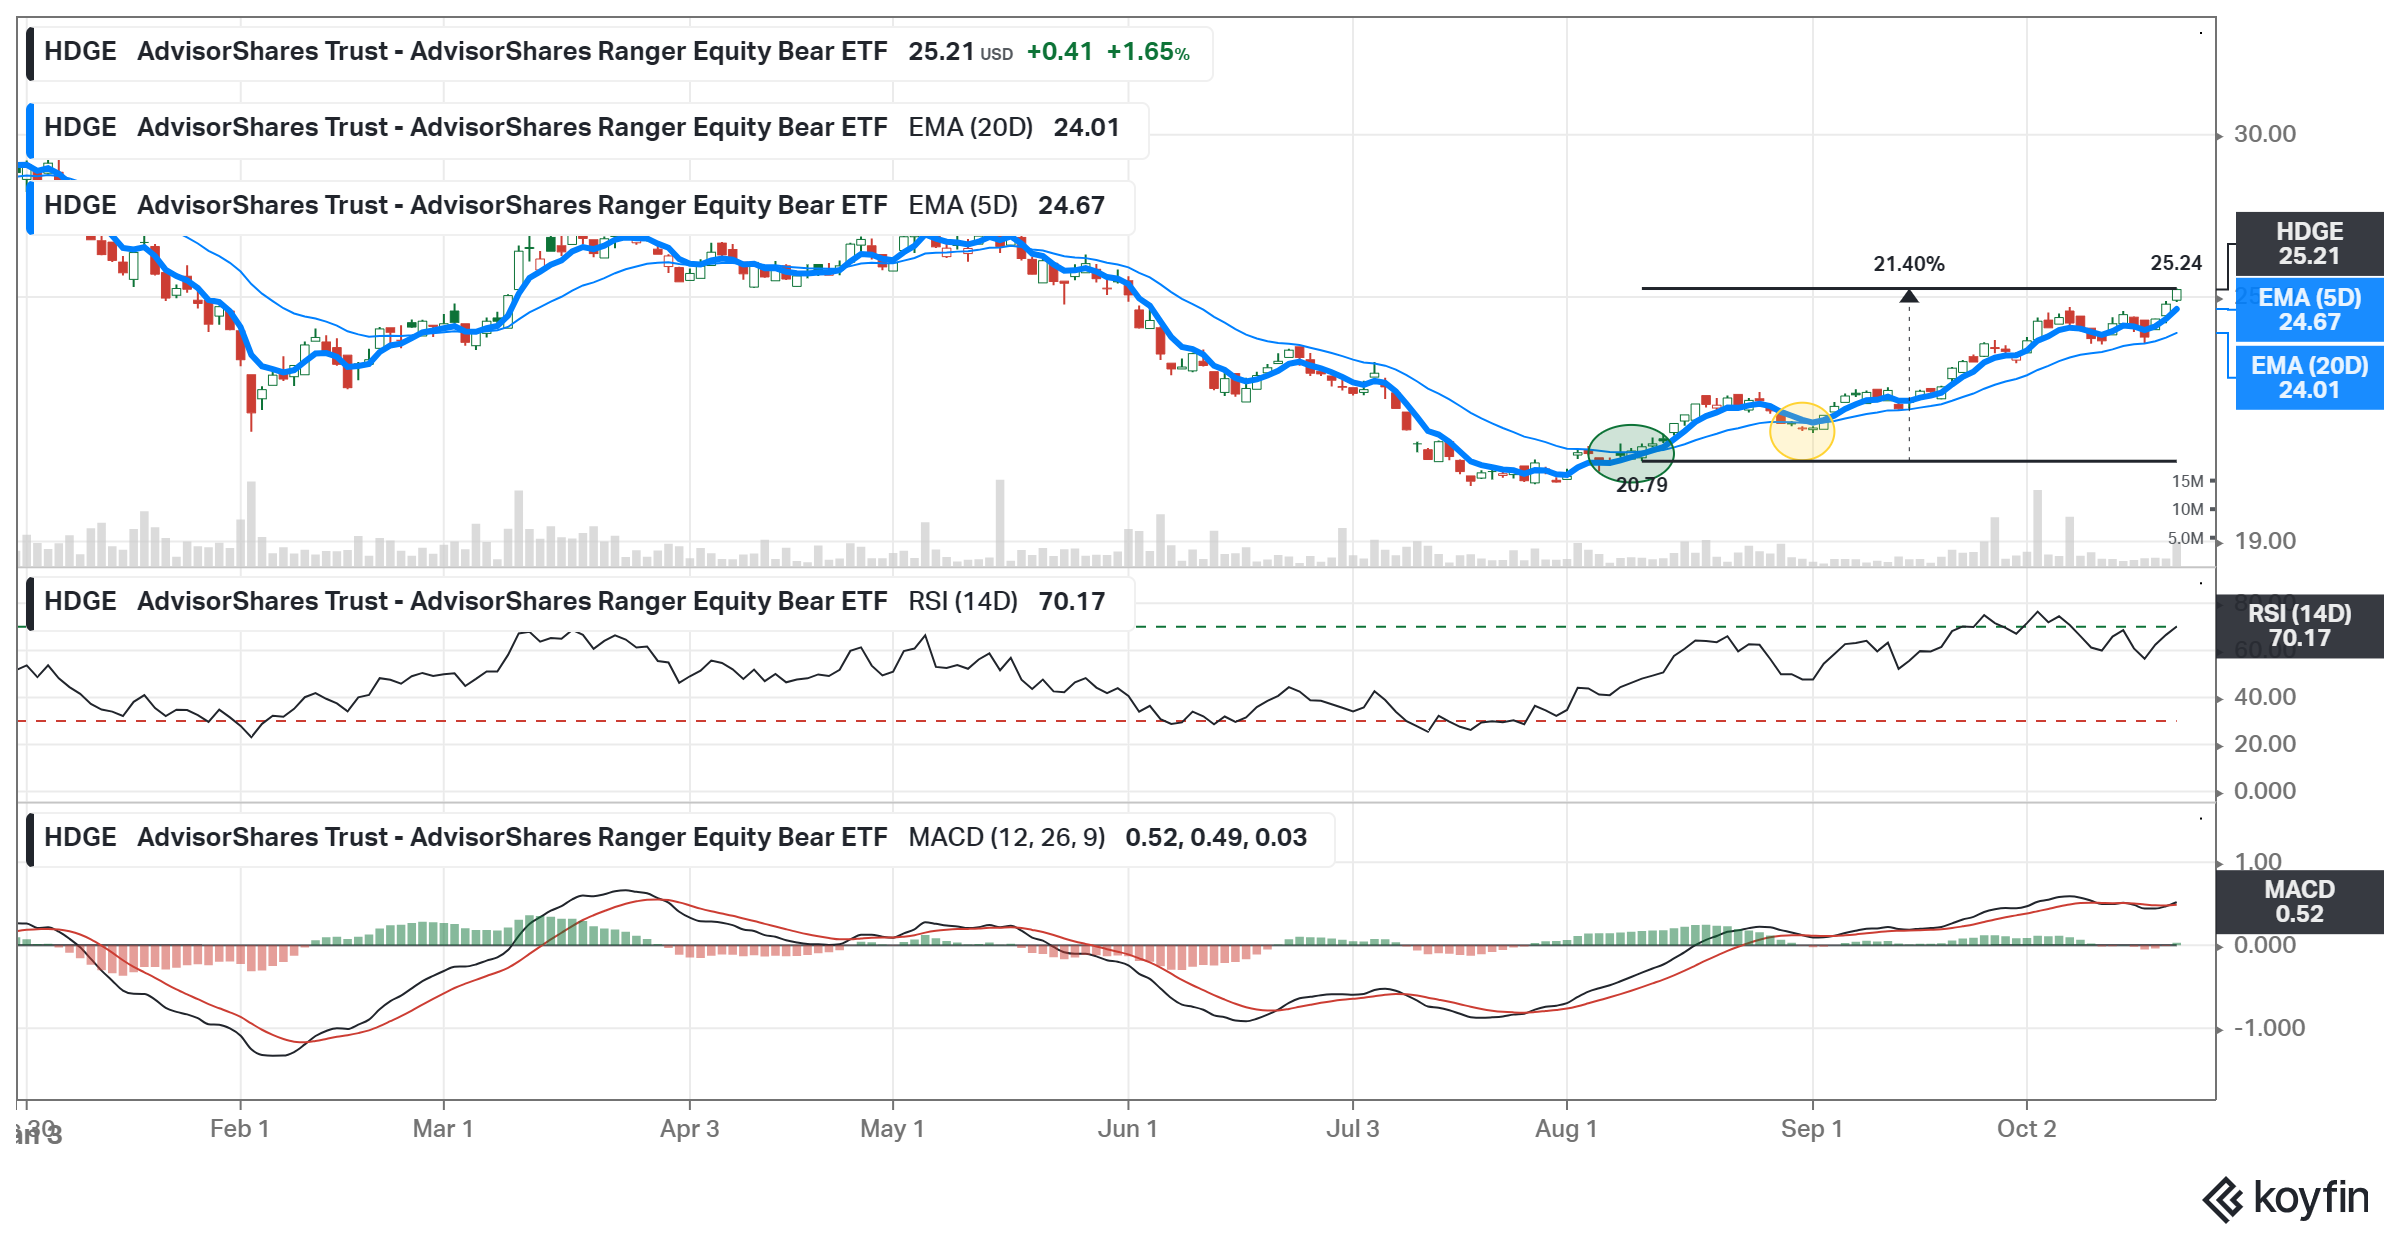
That’s about it.
The only bullish chart you are going to find these days is a bearish or inverse related ETF. I look for the upcoming earnings to move the needle one way or the other.
Activity in the middle east will remain the wild card for a while and don’t forget about the three ring circus here at home in DC. I want to be positive, but sometimes being a realist is the only option.
Have a great week!