

I read charts like headlines. I seek them out, absorb, move on to the next. I have always been a numbers guy but when you put those numbers in visual form? I pay attention with a voracious vengeance.
My daily recap email from Bloomberg today mentioned unemployment hadn’t been at these levels since 1969. Really? 1969?
That was a special year for me. Never mind the fact I wasn’t born yet, the New York Jets won Super Bowl III that year. Joe guaranteed victory and by God he delivered. Joe became Broadway Joe.
My favorite Bond film was released in 1969. On Her Majesty’s Secret Service. Best musical score period – no discussion – and who can’t appreciate future Kojak as the villain?
I decided to fact check Bloomberg and did a quick query on Koyfin. Have we not been at 3.4% unemployment since 1969?
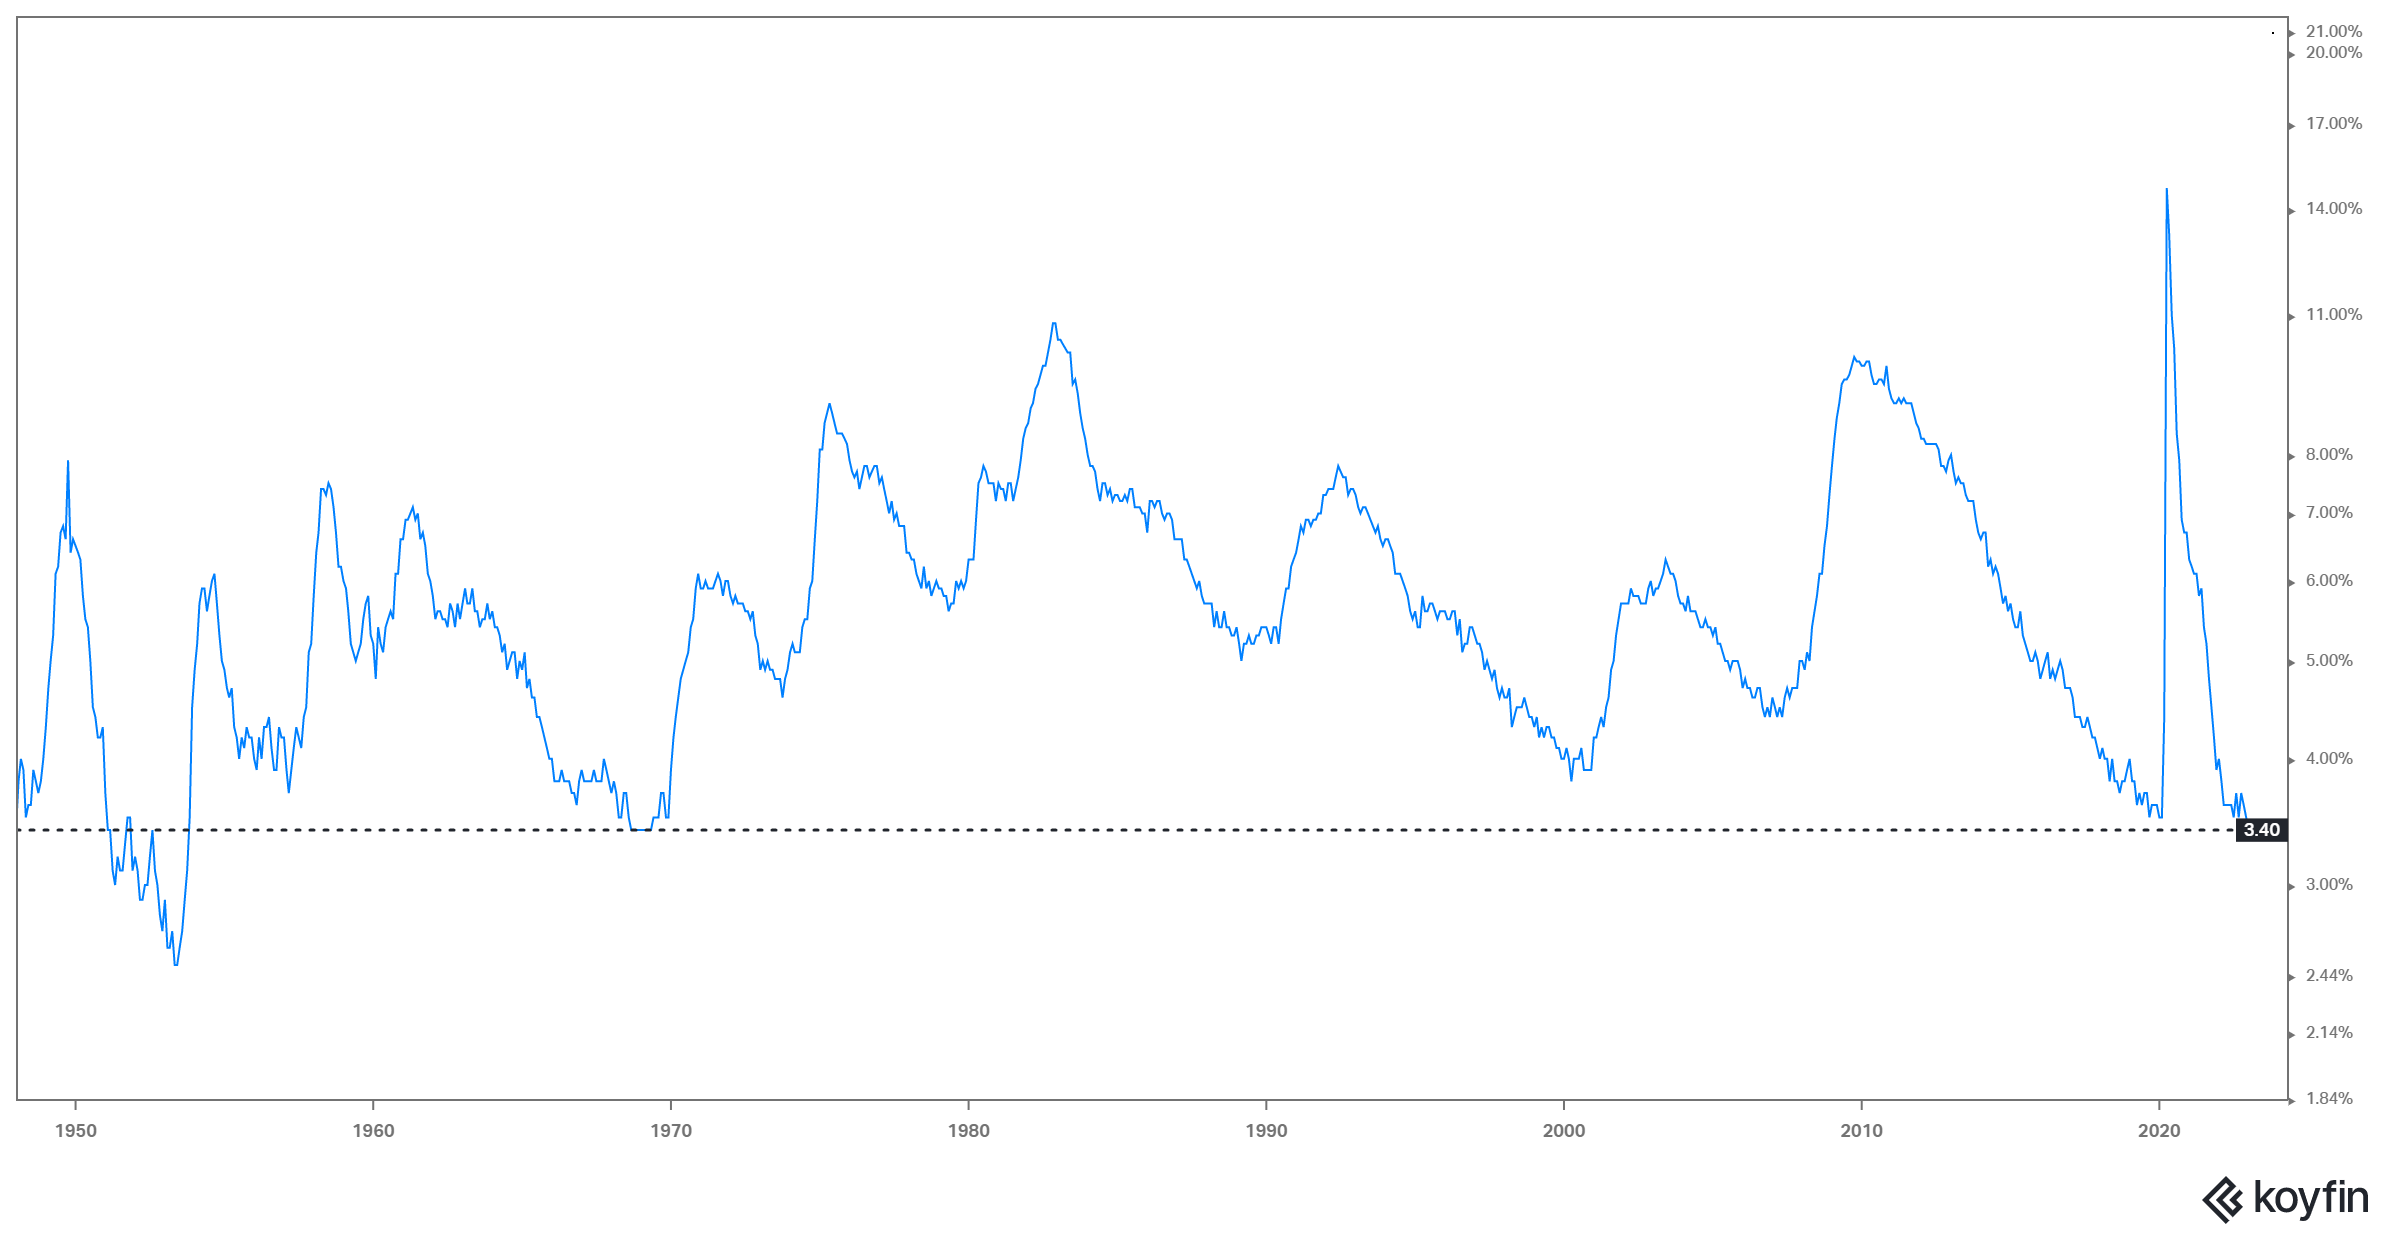
That is correct sir. 1969. Any other questions?
If you need a job, if you want a job, there is a job to be had. This is good news for the American public, questionable news for a Federal Reserve trying to fight inflation.
After pulling down the unemployment rate, I started thinking. What “rates” am I watching?
- Unemployment
- CPI Inflation
- Fed Funds
Let’s create the chart crime of the century, combine all three, and take a look at what they say for each decade up to today. May not tell me a damn thing. May be magnificent!
Only one way to find out:
1970’s

Note how in 1972 the Fed Funds starts rising on front of the CPI. Leads it. Then starts falling ahead of rising unemployment. CPI catches up to the Fed Funds rate and then it hits the fan. Up we go with the Fed Funds mirroring the move. Plenty of work though as unemployment continues to drift lower. (Remember that parallel)
1980’s
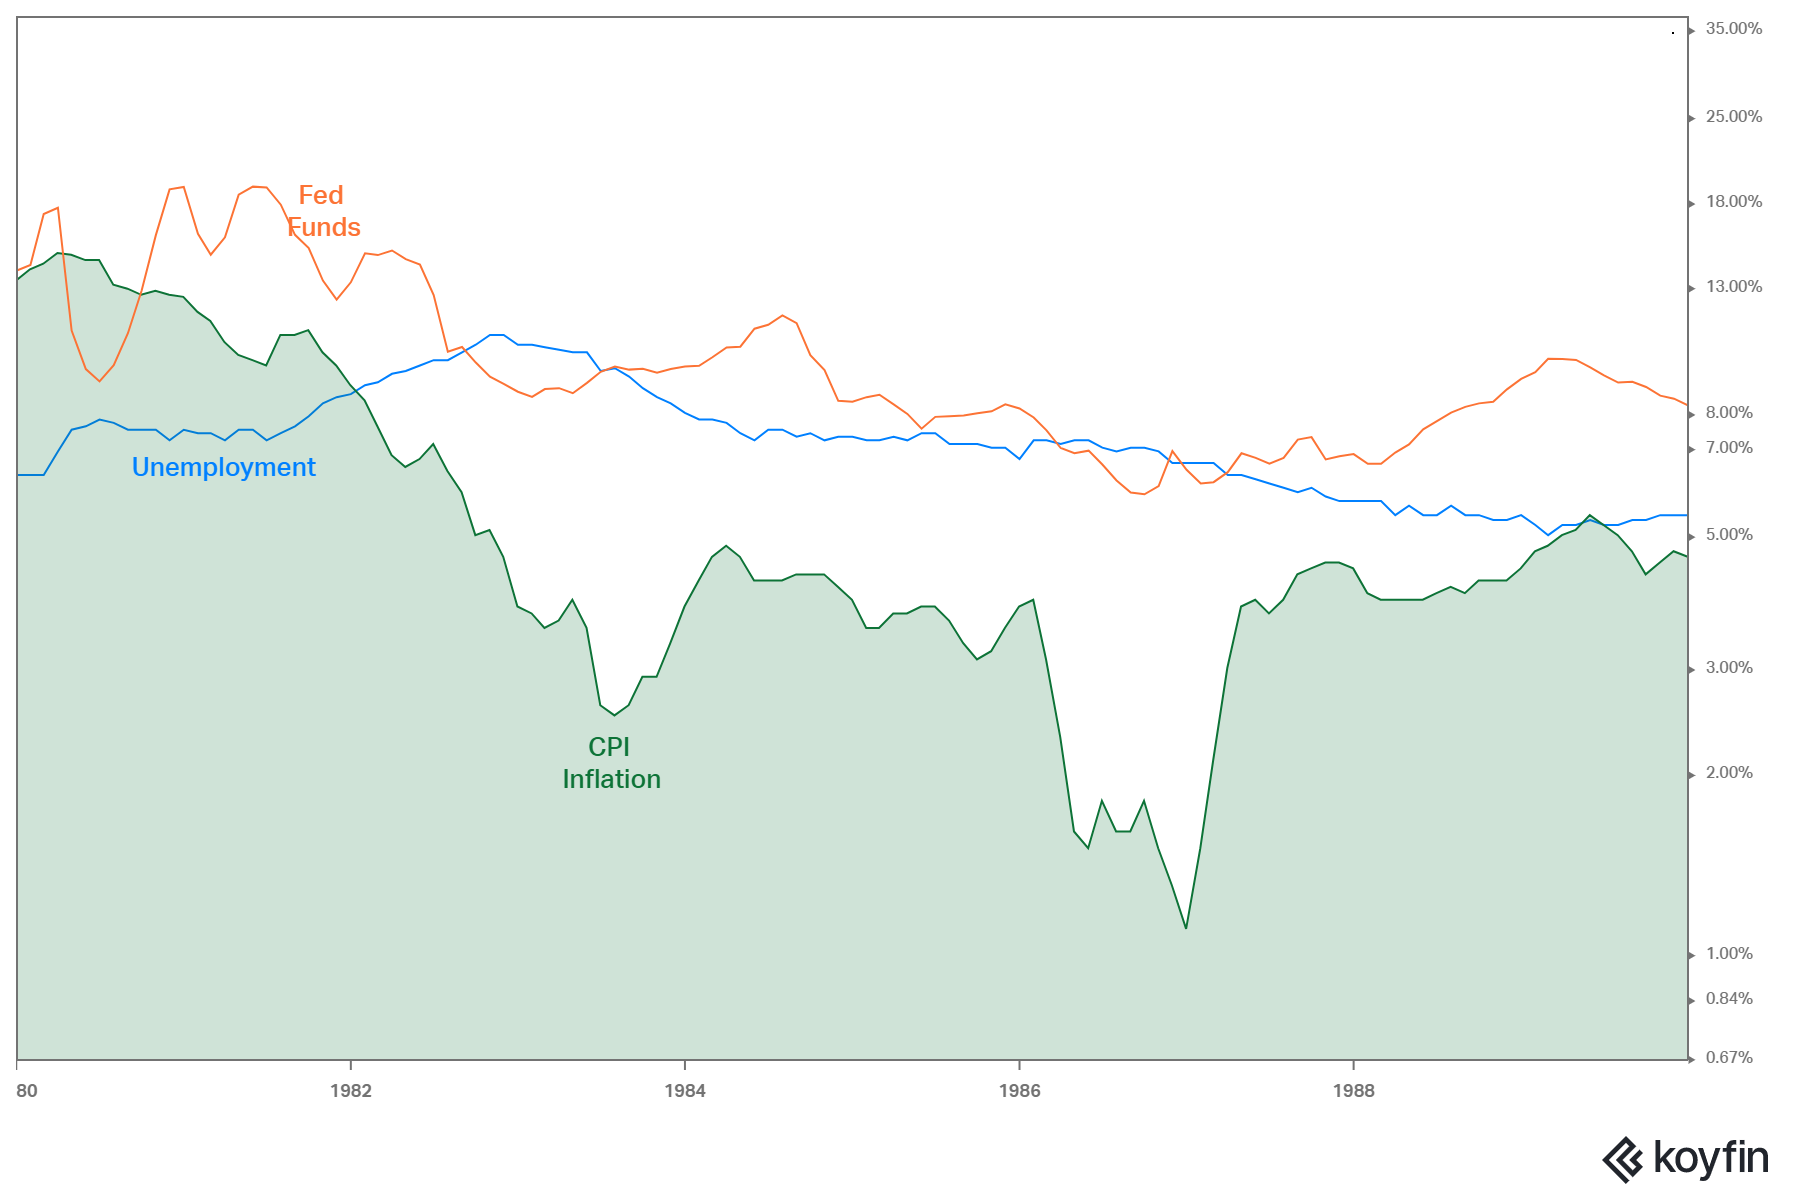
I love the 80’s. I am a child of the 80’s and still migrate back to that music even to this day. So when I look back on that period “economically” I see stability, surprisingly. Inflation is headed south, unemployment is drifting lower, Fed Funds is is tagging along. Welcome relief from the 70’s is about all I can say when looking at this one.
1990’s
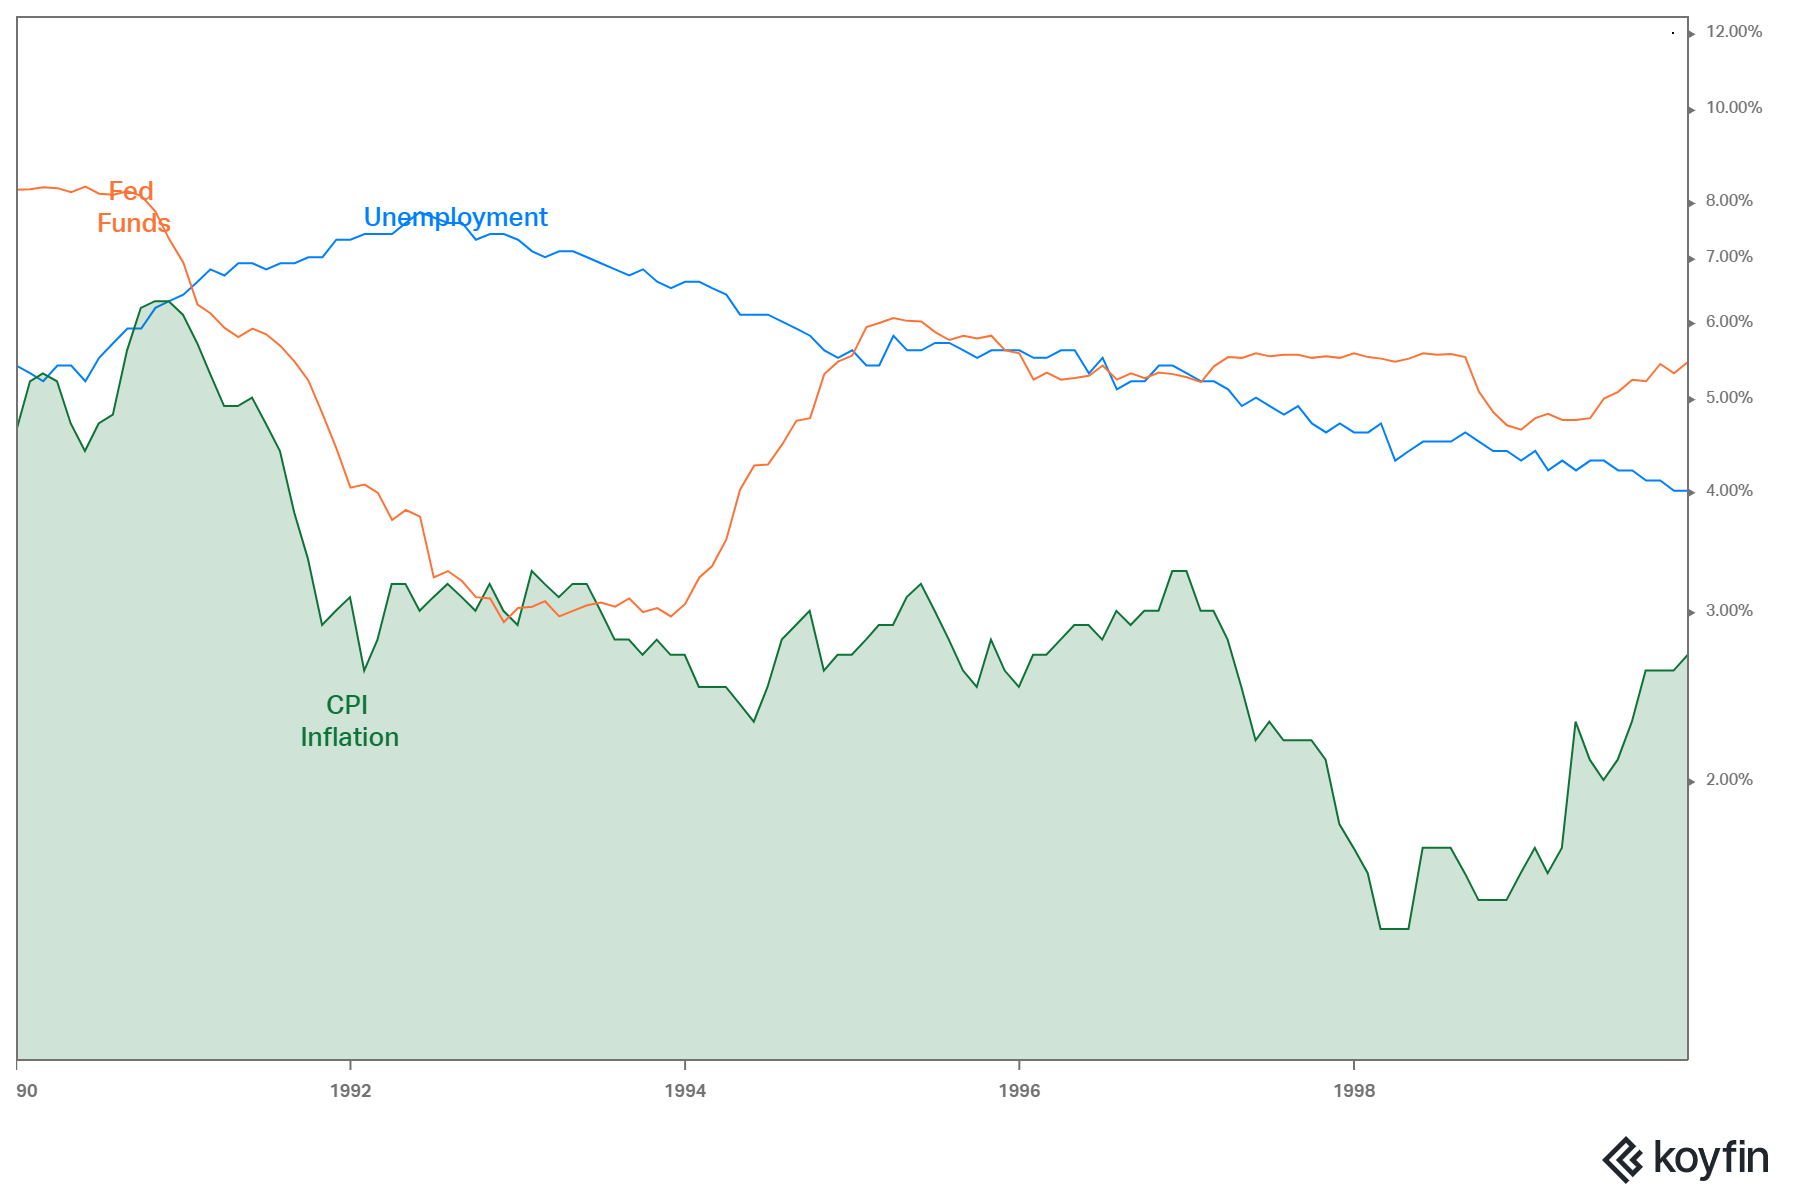
The 90’s brought war with it as I recall, and you can see the sharp drop in inflation with higher unemployment . Fed Funds lagged the CPI but quickly got ahead of CPI and stayed there for the Clinton years. Unemployment steadily declined.
2000’s
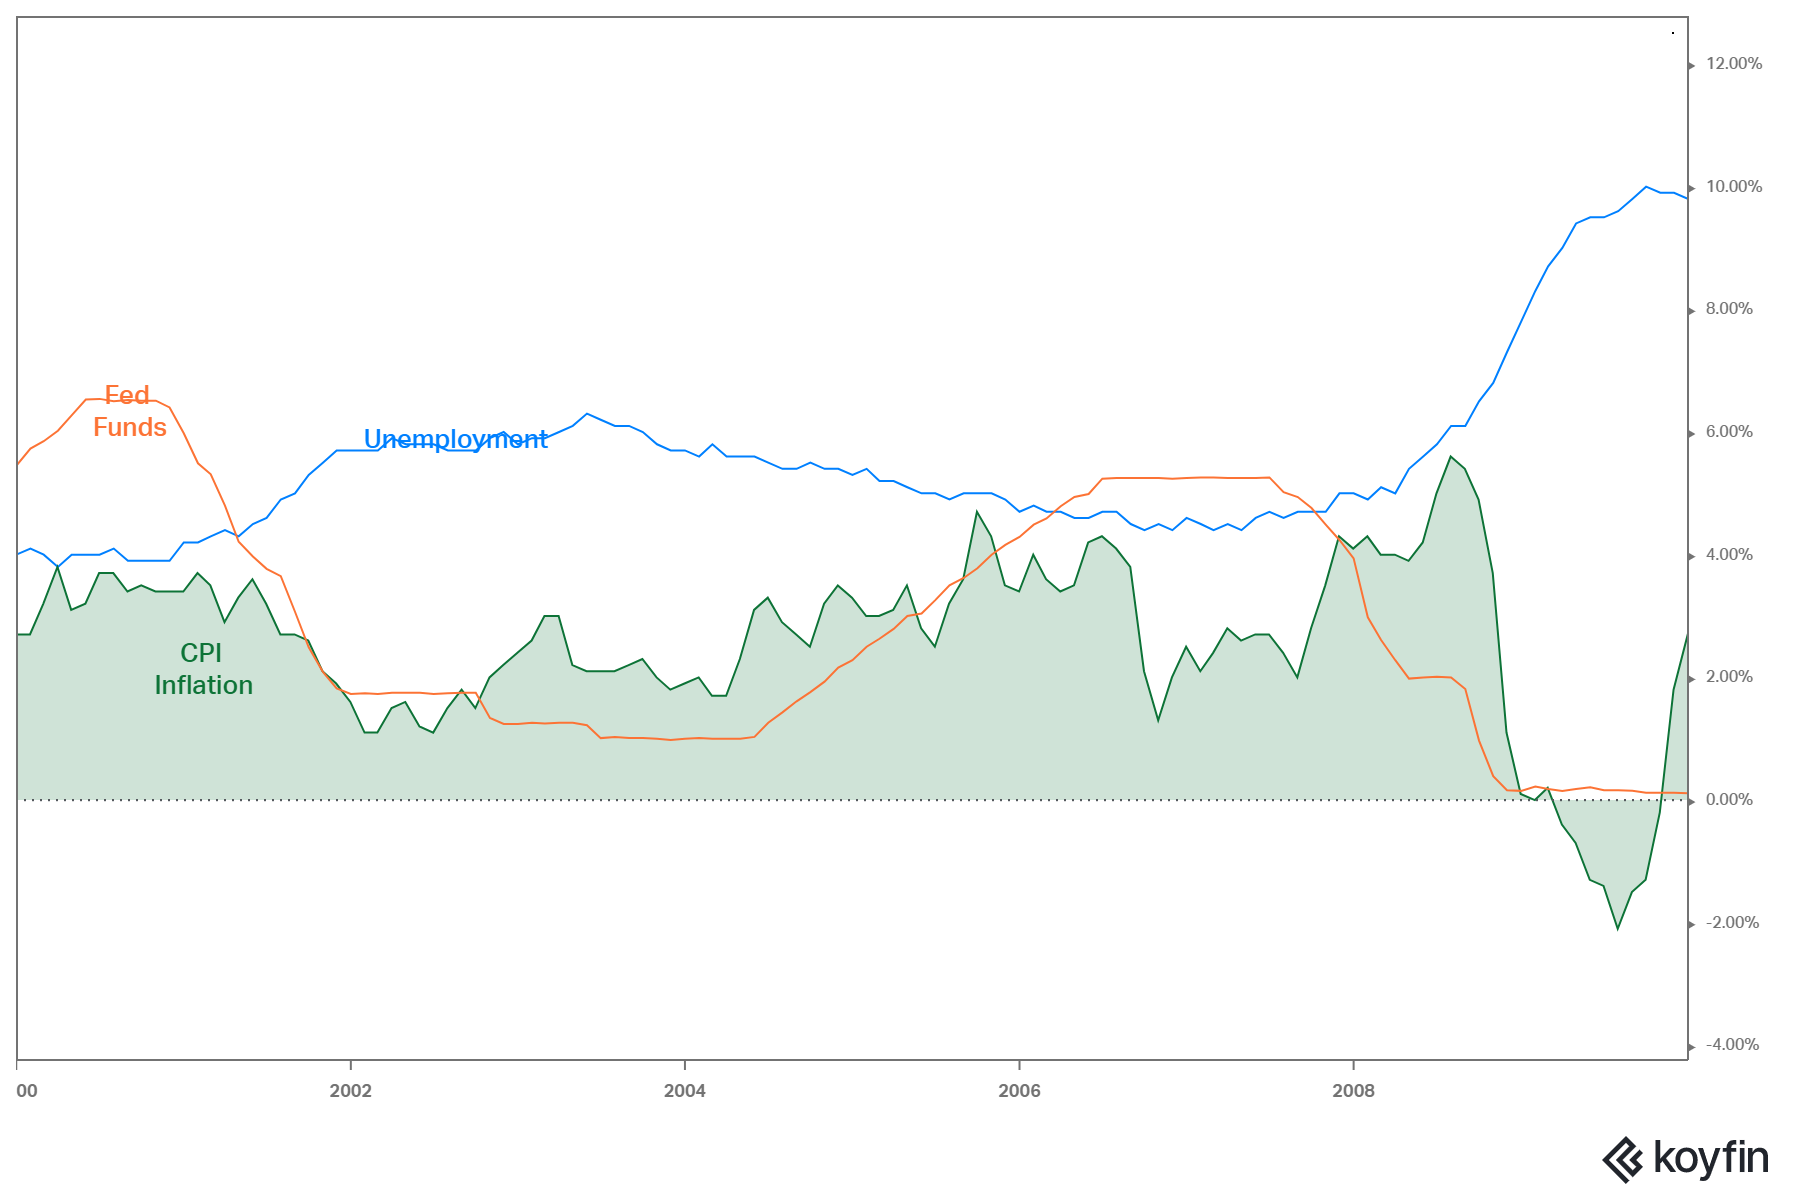
Turn of the century things get a little crazy. The tech bubble implosion followed by 9/11 and you have inflation and Fed Funds headed south, unemployment headed north. Things normalize mid decade until the GFC in 2008 derails everything. Fed Funds go zero, inflation dives, unemployment spikes.
2010’s
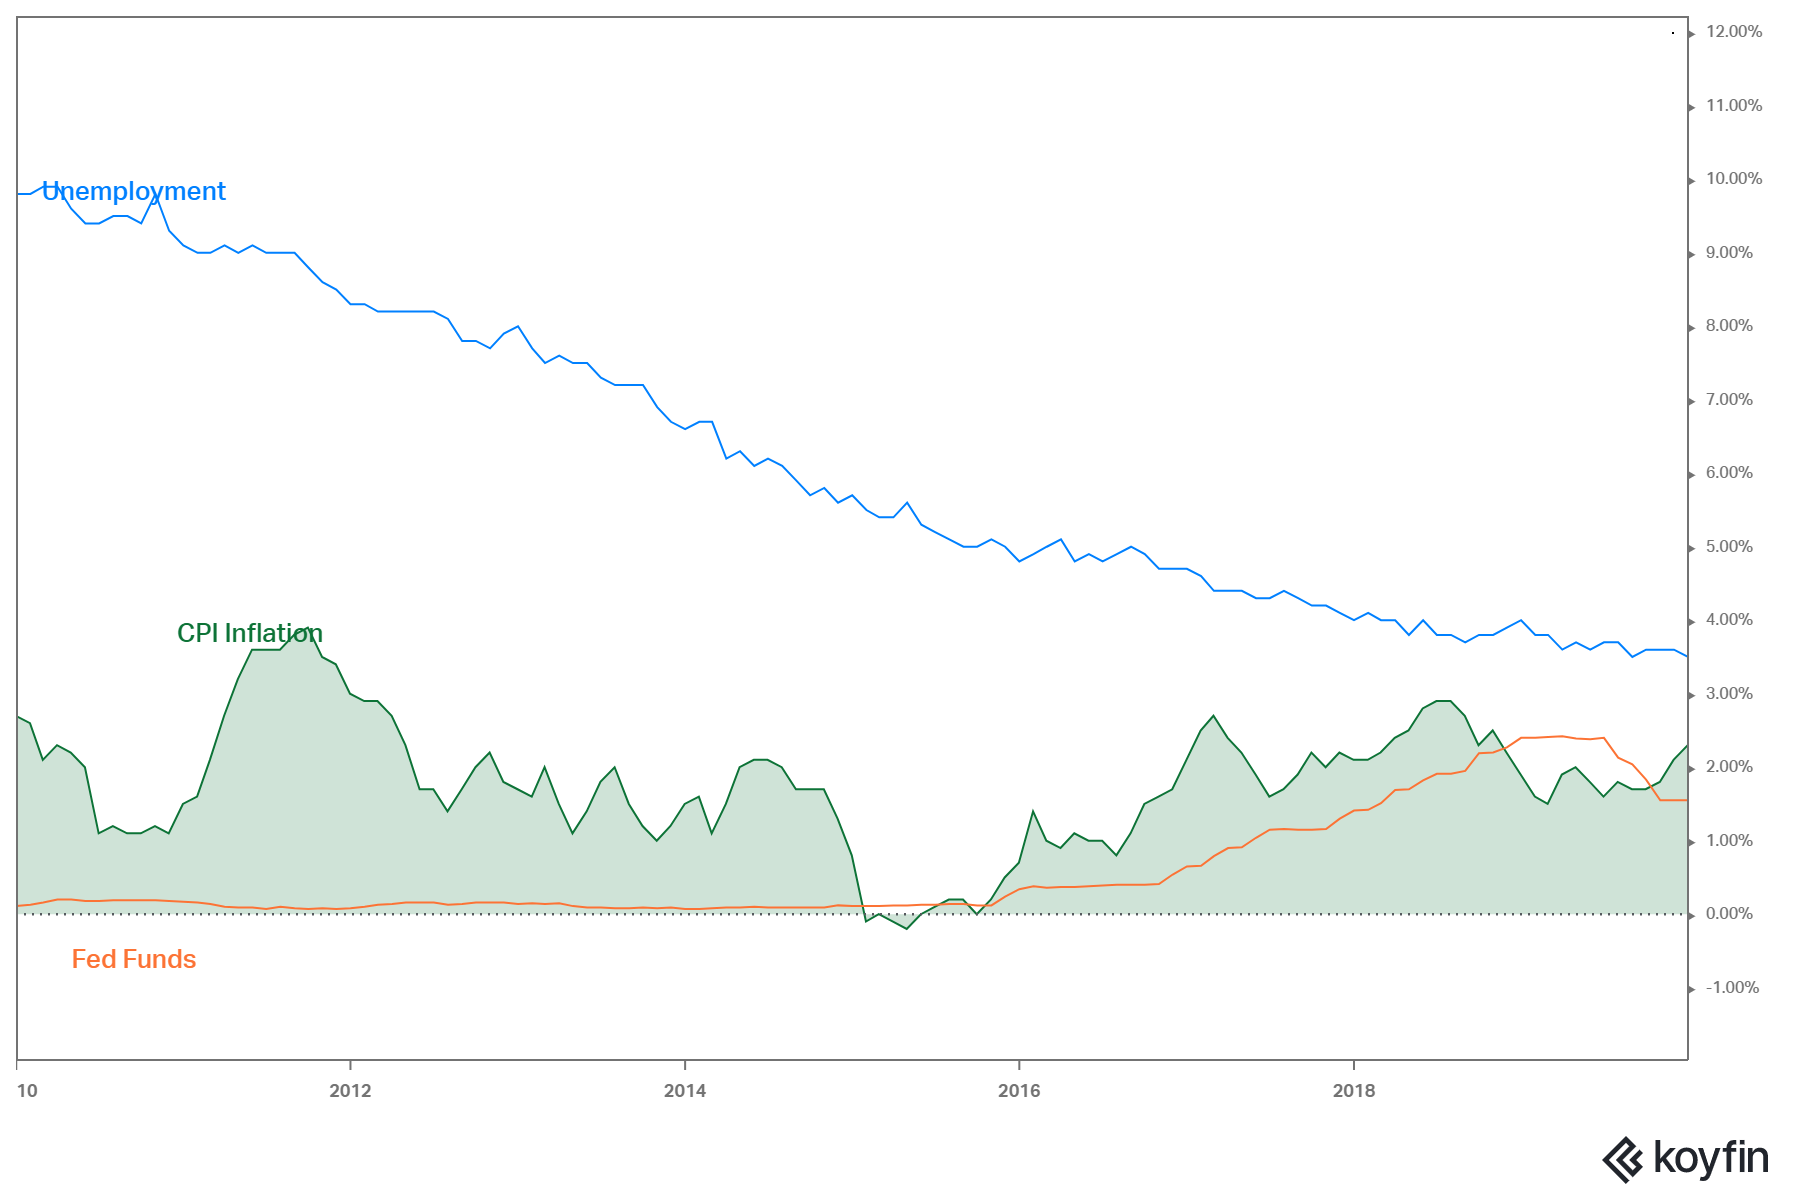
Not sure we fully realize how good we had it in the 2010s. Fed Funds pegged to zero, unemployment steadily declining, inflation hovering around the 2% target. The Golden Years.
2020’s
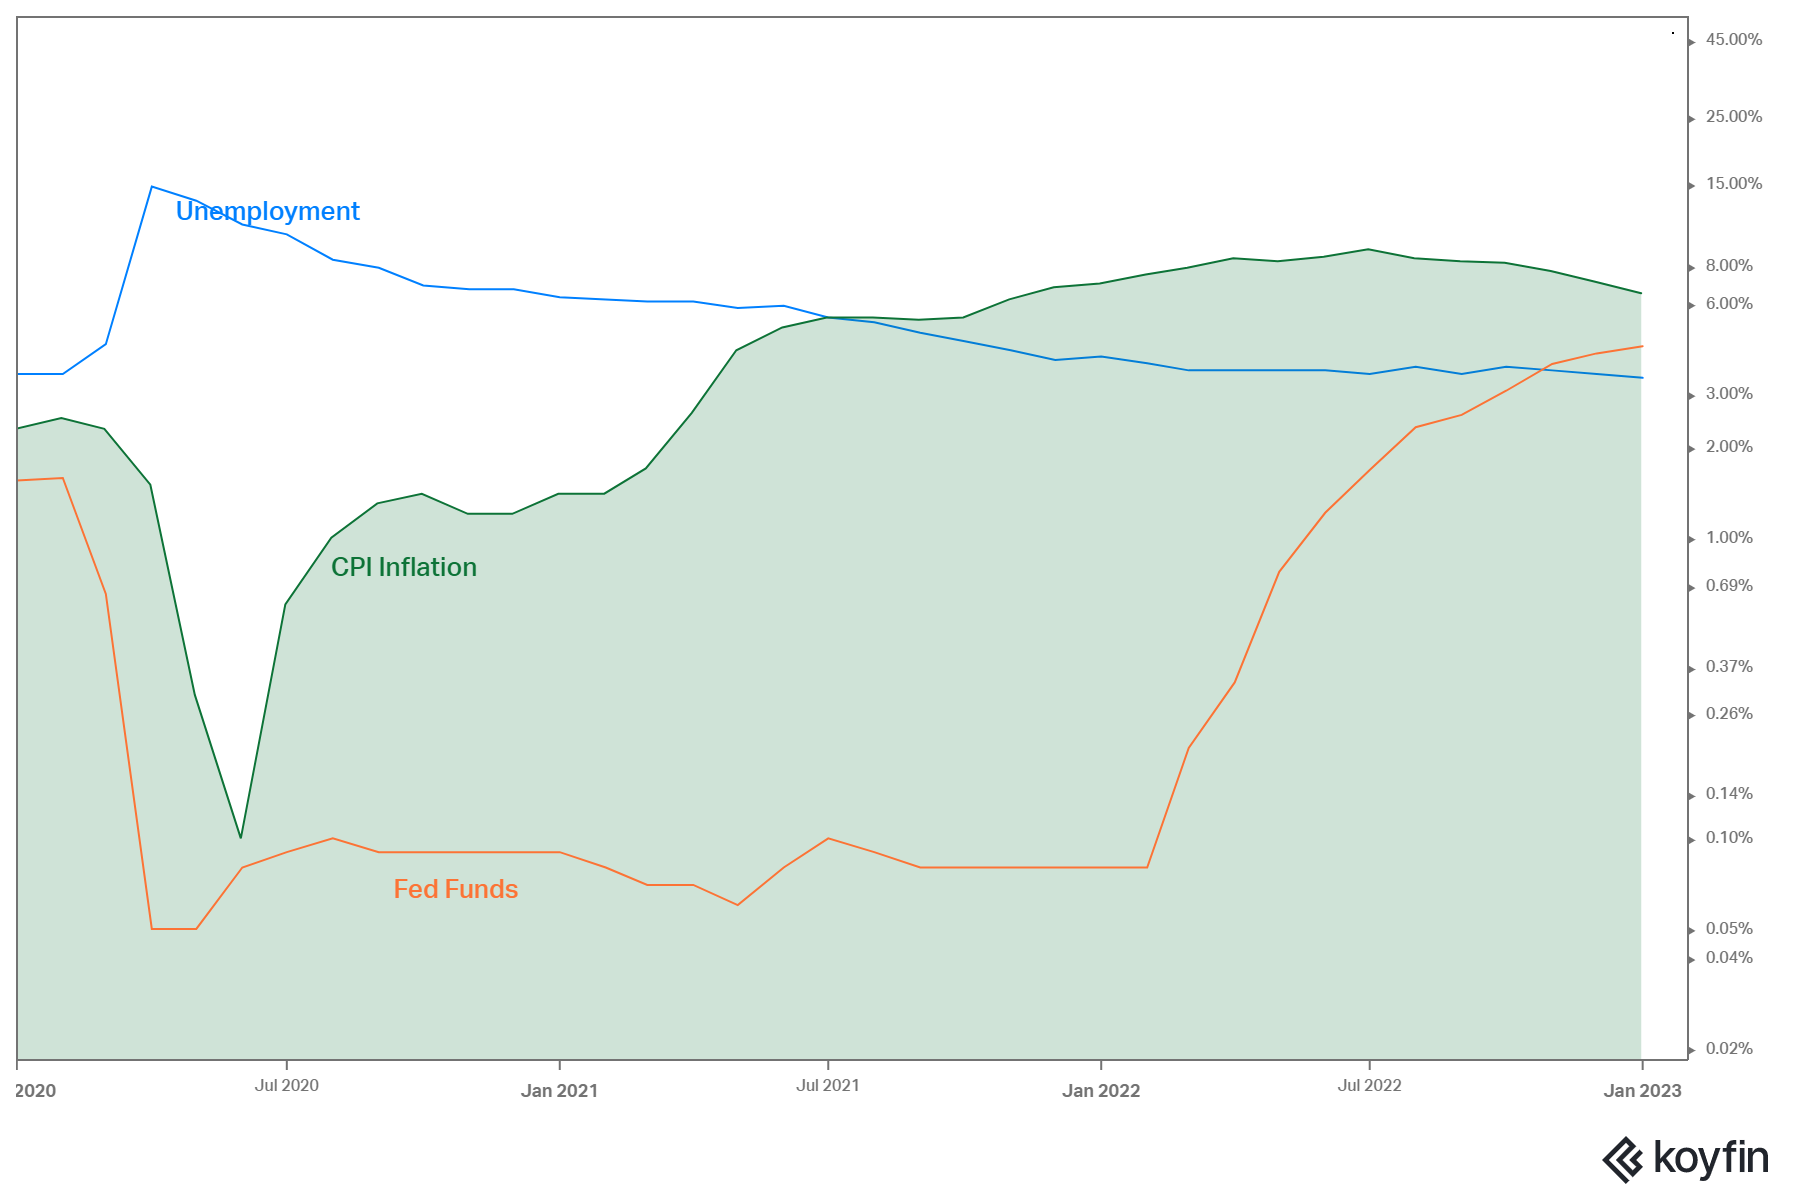
The start of the 2020’s is a little “dramatic”? Pandemic. Unemployment spikes. Inflation spikes.
The Fed………………………………
waits…………………………………………
to see…………………………………..
what to do.
Then quickly decides we need to hike and hike like yesterday!
Just as the pandemic was an abrupt adjustment, the Fed hiking cycle we have just endured is equally as abrupt.
on balance
My biggest takeaway from reviewing the rates via decades was a proactive Fed vs. a reactive Fed. The contrast between the Fed Funds leading CPI readings in the early 70’s compared to the complacent lag we have witnessed recently is stark.
But here’s the deal. The pandemic changed everything. EVERYTHING. Movements are extreme and equally as swift. We are still, to this day, trying to “normalize”. Remember normal, the sheer stillness of normal? Very few can.